Note: The following is an excerpt from this week’s Earnings Trends report. You can access the full report that contains detailed historical actual and estimates for the current and following periods, please click here>>>
Here are the key points:
- The market will be looking for the strong earnings momentum we saw in the last reporting cycle to continue in the June-quarter earnings season as well, whose early reports have started coming out already.
- The expectation is that companies will not only beat seemingly elevated Q2 estimates, but also provide guidance that will help raise estimates for the second half of the year.
- Total Q2 earnings for the S&P 500 index are expected to be up +59.3% from the same period last year on +17.6% higher revenues, which would follow the +47.6% earnings growth on +8.4% higher revenues in 2021 Q1.
- A big part of the strong Q2 earnings growth is easy comparisons to the year-earlier period that represented the bottom of the Covid-19 earnings impact. But Q2 estimates also reflect genuine growth, with total index earnings expected to be up +7.8% from the pre-Covid 2019 Q2 period.
- Total 2021 Q2 earnings for 9 of the 16 Zacks sectors are expected to be up from the pre-Covid 2019 Q2 period, including Technology (up +30%), Basic Materials (+63.8%), Medical (+20.9%), Retail (+23.9%), Construction (+50.1%).
- Sectors whose 2021 Q2 earnings are expected to remain below the comparable 2019 period include Transportation (down -70.5%), Consumer Discretionary (-52.5%), Autos (-73.3%), and Energy (-17%).
- Estimates for Q2 and beyond have been steadily going up, with the current +59.3% earnings growth rate up from +50.6% at the end of March and +41.6% at the start of January 2021.
- Looking at the calendar-year picture for the S&P 500 index, earnings are projected to climb +34.1% on +10.3% higher revenues in 2021 and increase +11.6% on +6.4% higher revenues in 2022. This would follow a decline of -13.1% in 2020 on -1.7% lower revenues.
- The implied ‘EPS’ for the S&P 500 index, calculated using the current 2021 P/E of 23.1X and index close, as of June 1st, is $182.19, up from $135.91 2020. Using the same methodology, the index ‘EPS’ works out to $203.30 for 2022 (P/E of 20.7X). The multiples have been calculated using the index’s total market cap and aggregate bottom-up earnings for each year.
We continue to believe that positive revisions to estimates is the part of the earnings story that stock market investors should find the most reassuring, as this provides the most convincing fundamental rationale for stocks to hold onto and build on their values.
The chart below shows how estimates for the current period (2021 Q2) have evolved since early January. In most ‘normal’ periods, we will be seeing negative estimate revisions; meaning earnings estimates would be going down. We are seeing the opposite, with estimates going up, as the chart below shows.
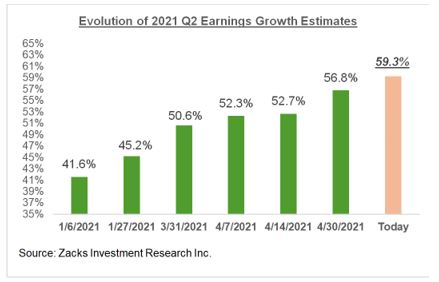 Image Source: Zacks Investment Research
Please note that this is a replay of what we experienced in Q1 as well, though the pace of positive revisions is stronger for Q2 and beyond. In fact, this trend of positive revisions started back last Summer as the U.S. economy started coming out of the pandemic-driven lockdowns. While the direction of revisions is the same, the pace and magnitude of positive revisions has only accelerated, a trend that we expect will gain further pace in the second half of the year.
We are seeing the same trend at play in estimates for full-year 2021, as the chart below shows.
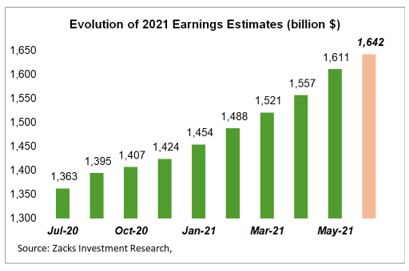 Image Source: Zacks Investment Research
The chart below shows the same revisions trend at the index ‘EPS’ level since last Summer.
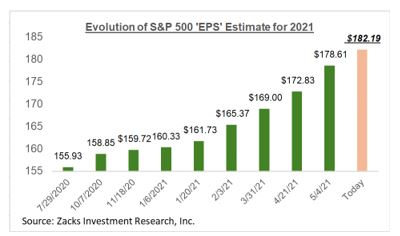 Image Source: Zacks Investment Research
The most impressive aspect of this favorable revisions trend is that estimates are going up across the board for most sectors. Of the 16 Zacks sectors, estimates have gone up for 14 sectors since the start of the year, with the Energy, Basic Materials, Construction, Finance and Technology sectors enjoying the largest proportional increases in estimates.
You can see this phenomenon in estimates for bellwether operators in a variety of sectors. Check out, for example, full-year 2021 EPS estimates for Dow (DOW), JPMorgan (JPM), Chevron (CVX) and Alphabet (GOOGL) and you will find that EPS estimates have gone up +80.2%, +22.7%, +61.4% and +27.3% over the past three months, respectively.
The Earnings Big Picture
The chart below provides a big-picture view of earnings on a quarterly basis.
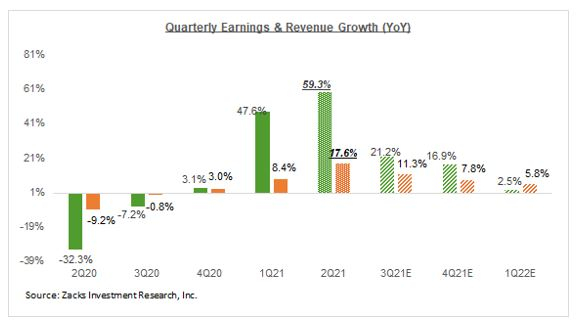 Image Source: Zacks Investment Research
The chart below shows the overall earnings picture on an annual basis, with the growth momentum expected to continue.
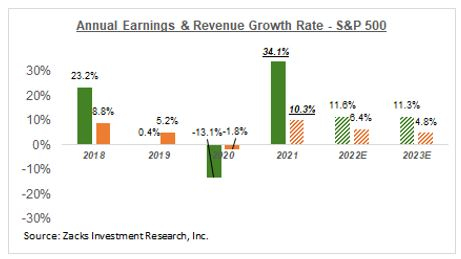 Image Source: Zacks Investment Research
We remain positive in our earnings outlook, as we see the full-year 2021 growth picture steadily improving, with the aforementioned revisions trend accelerating in the back half of the year.
More Stock News: This Is Bigger than the iPhone!
It could become the mother of all technological revolutions. Apple sold a mere 1 billion iPhones in 10 years but a new breakthrough is expected to generate more than 77 billion devices by 2025, creating a $1.3 trillion market.
Zacks has just released a Special Report that spotlights this fast-emerging phenomenon and 4 tickers for taking advantage of it. If you don't buy now, you may kick yourself in 2022.
Click here for the 4 trades >>
Want the latest recommendations from Zacks Investment Research? Today, you can download 7 Best Stocks for the Next 30 Days. Click to get this free report
JPMorgan Chase & Co. (JPM): Free Stock Analysis Report
Alphabet Inc. (GOOGL): Free Stock Analysis Report
Dow Inc. (DOW): Free Stock Analysis Report
Chevron Corporation (CVX): Free Stock Analysis Report
To read this article on Zacks.com click here.
Zacks Investment Research
The views and opinions expressed herein are the views and opinions of the author and do not necessarily reflect those of Nasdaq, Inc.


