
DailyFX.com -
Talking Points:
- Gold's appeal as a safe haven has been called into question after a weak performance during the most recent period of market stress.
- Rising short-term interest rates in the US, coupled with a strong US Dollar, have limited the appeal of Gold in the near-term.
- Retail traders remain net-long Gold, but sentiment has started to shift: the crowd is now 79% net-long from 82% last week.
See our longer-term forecasts for the US Dollar, Euro, British Pound and more with the DailyFX Trading Guides
Gold has had a rough 2018 year-to-date. Currently down by -2.7% in August, Gold prices are pacing for their fifth consecutive month of losses, and their sixth of eight overall this year. The performance by bullion is that much more alarming when considering seasonality, which has seen, on average, August produce the second best month of gains over the past five years. Historically, the three-month stretch between June and August is supposed to be the best time of the year to own Gold.
Needless to say, events have unfolded in a manner unfavorable for Gold prices. The appeal of bullion as a safe haven has been called into question in recent weeks, after a particularly uninspiring performance given the Turkish Lira meltdown and its knock-on contagion effect on emerging markets as well as continually rising tensions in the US-China trade war.
The main culprit for Gold's lack of strong performance this year is undoubtedly the US Dollar. Every month this year that Gold fallen, the US Dollar (via the DXY Index) has rallied; and vice-versa. The combination of rising short-term interest rates (the US 1s10s, 2s10s, and 5s30s spreads are at their lowest levels in a decade) and the stronger US Dollar (the best performing major currency in Q2'18 and thus far in Q3'18) has been a major impediment.
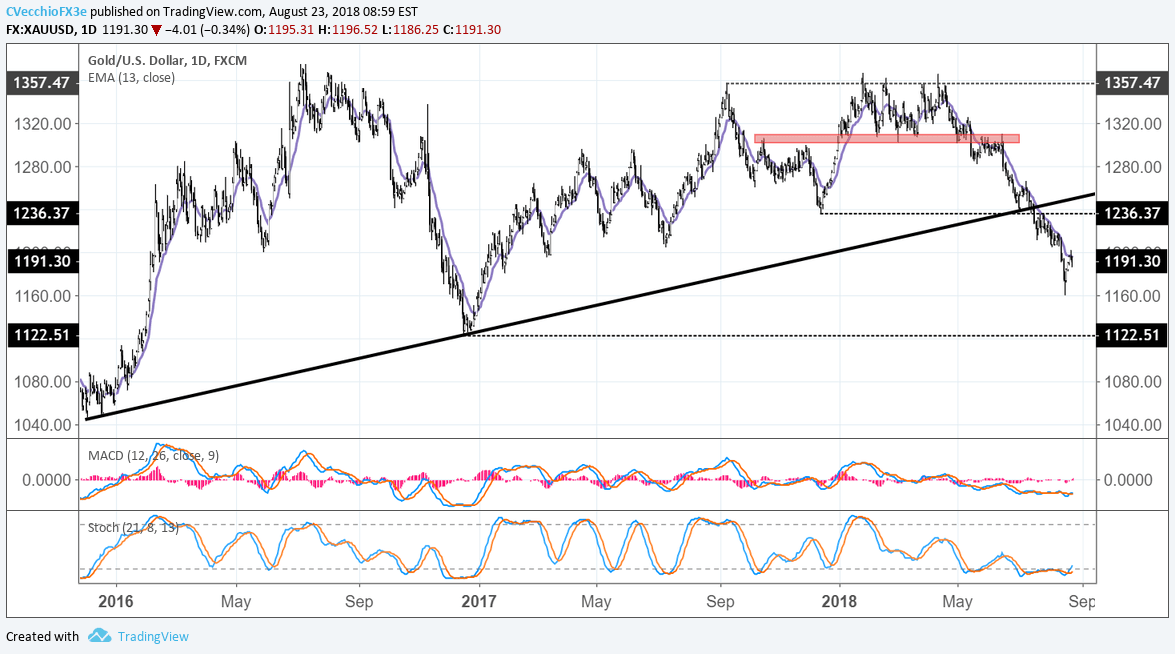
Gold Price Chart: Daily Timeframe (December 2015 to August 2018 ) (Chart 1)
In recent weeks, Gold price crashed through the rising trendline from the lows seen in December 2015 and December 2016. During this process, the swing low from December 2017 was taken out in the process. Expectations from earlier this year of a Gold breakout materializing have fallen far short.
Gold Price Chart: Daily Timeframe (January 2017 to August 2018) (Chart 2)
The technical posture of Gold in the near-term remains weak, and the downtrend is still well-established. But the downtrend is seemingly fragile, with clear levels to watch for the topside to determine the appropriate bias.
For now, so long as Gold remains below its daily 13-EMA - a moving average it has not closed above since June 15 - a bearish bias remains appropriate. Upon a close above the daily 13-EMA, the outlook would switch from bearish to neutral. The only scenario in which a legitimate bullish bias (beyond a near-term scalping opportunity) would materialize would be if price were to overtake 1236.37, the December 2017 swing low that quickly morphed into resistance once broken on July 17.
Read more: The Case for the US Dollar Topping Out
FX TRADING RESOURCES
Whether you are a new or experienced trader, DailyFX has multiple resources available to help you: an indicator for monitoring trader sentiment ; quarterly trading forecasts ; analytical and educational webinars held daily ; trading guides to help you improve trading performance , and even one for those who are new to FX trading .
--- Written by Christopher Vecchio, CFA, Senior Currency Strategist
To contact Christopher Vecchio, e-mail cvecchio@dailyfx.com
Follow him on Twitter at @CVecchioFX
DailyFX provides forex news and technical analysis on the trends that influence the global currency markets.
Learn forex trading with a free practice account and trading charts from IG .
The views and opinions expressed herein are the views and opinions of the author and do not necessarily reflect those of Nasdaq, Inc.
The views and opinions expressed herein are the views and opinions of the author and do not necessarily reflect those of Nasdaq, Inc.
