Over time, we hope to outpace this yardstick [the S&P 500]. Otherwise, why do our investors need us?Warren E. Buffet's Owner's Manual
Introduction
Passive funds have the advantages of lower fees and diversification. But they also have significant disadvantages in that they likely include companies with poor financial health (as was the case with Lehman Brothers as described in my prior article: Fixing Value Investing Underperformance, Part II). As well, passive funds typically Buy and Hold with no trading based upon the most currently available reported financial data. These disadvantages- coupled with potentially misleading top and bottom-line financial data, including price to earnings, price to book value, and price to sales have resulted in Value Investing’s decade-long persistent underperformance and increased risk.
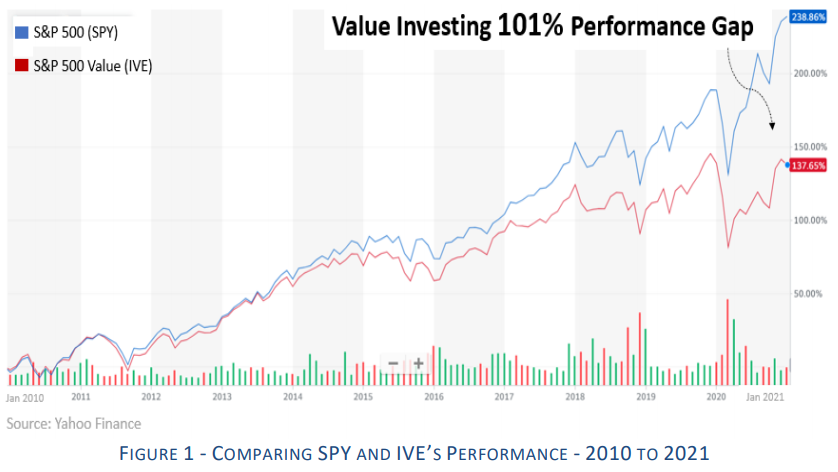
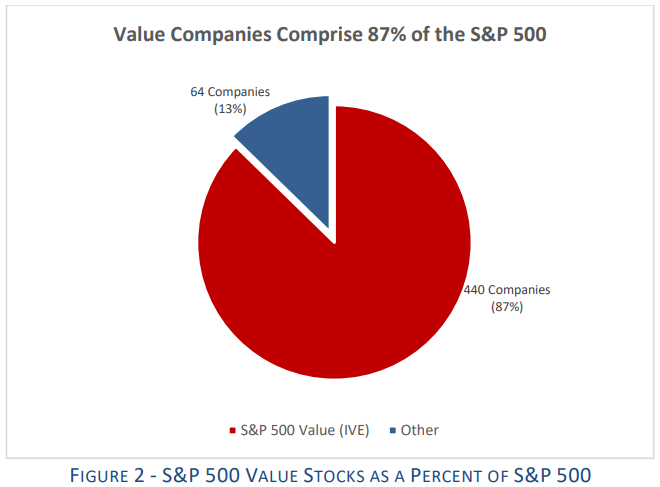
With 87% of the of S&P 500 components classified as Value (as of January 2021), this level of poor performance and increased risk should be of concern to investors, particularly individuals that are savings for their children’s education and their retirement, and for public pension funds that are struggling to meet their pension obligations to retirees.
A Fundamentally Driven Solution to Value Underperformance
Valspresso has taken a fundamentally driven approach to building portfolios of stocks that solve the traditional value investing underperformance problem. Unlike the traditional ratio-based classification of value stocks (described above), Valspresso’s defines and classifies companies’ stock as “value” when they pass the following three simple, but fundamental questions:
1. Is the company making money from its business?
2. Can the company pay its bills without borrowing?
3. Is the company structured to protect investors?
With these three simple questions, coupled with a deep fundamental analysis as the sole input, it is now possible to create low cost and diversified value stock investment portfolios that: 1) reduce single company risk and 2) deliver better portfolio returns at lower risk.
How does this Work?
Each day, AVA (Automated Valspresso Analyst) analyzes and classifies all publicly traded companies on the U.S. major exchanges. Companies are classified as High-Quality (if they pass all three questions), Medium-Quality (if they fail one question), or Low-Quality (if they fail two or more questions). AVA’s Fundamental Classification (FC) system is based upon a rules-based in-depth evaluation of a company’s P&L, balance sheet, and cash flow, as most recently updated with the latest 10k, 10q and 8k SEC filings.
This classification system has predictive power. The stocks of companies that are classified as High-Quality (as a group) tend to persistently outperform, with less risk, the stocks of companies that are classified as Medium-Quality or Low-Quality.
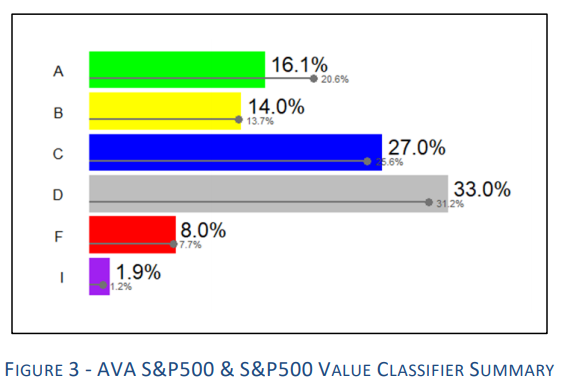
By combining the Fundamental Classification (FC) with other data points from GAAP (Generally Accepted Accounting Principles) financial statements, the system assigns to companies a Fundamental Grade (FG) that ranges from “A” to “F”, and “I” for those with incomplete data. The stocks of companies that are classified as “A” tend to persistently outperform (with less risk) the relevant benchmark and stocks of companies with grades “B” to “F”. See our “Capturing the Predictive Value of Fundamental Analysis with a New Lens” for details.
The following graph shows, with colored bars, Valspresso’s Fundamental Grade Classifications for S&P Value components in comparison to the classifications as applied to the S&P 500, shown with solid lines. Knowing that “A” classified companies outperform all other classes demonstrates the weakness of the Value grouping as well as the weakness of the S&P 500 at large.
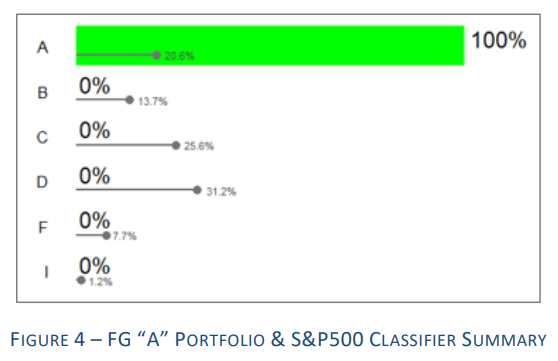
To demonstrate the power of FG “A” classification in delivering better performance at reduce risk, we used the AVA system to build and back test a portfolio of FG “A” companies. The holdings were selected from the universe of large cap companies (market cap > $10 billion) traded on the U.S. stock exchange. ADRs were excluded.
During the back testing period (1/1/2010 to 9/30/2020), the portfolio consisted of 100% FG “A” companies. At the end of the back testing period, the portfolio comprised of 412 holdings. The following graph shows, with colored bars, the Fundamental Grade Classifications for the 412 holdings in comparison to the classifications as applied to the S&P 500 (shown with the solid lines).
Below is the performance result of the back tested Fundamental Grade “A” portfolio relative to the S&P 500 and S&P 500 Value Index.
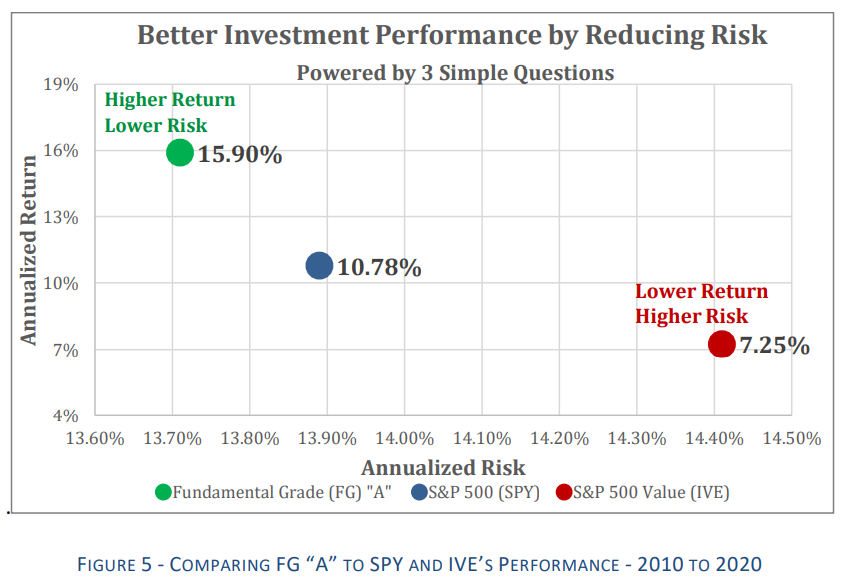
This use case illustrates the power of Fundamental “A” classification applied to the U.S. Large Cap universe. It is important to note that our research showsthat Fundamental Grade “A” classification delivers better performance consistently when applied across all market caps (large, mid, and small), investment styles (value, core, and growth), investment mandates (for example ESG), and other users-defined strategies.
Conclusion
According to the FASB (Financial Accounting Standards Board), the objective of GAAP financial reporting is to provide information that is useful to current and potential investors in making investment decisions. And for accounting information to be relevant to decision making, it must possess predictive value. Our research demonstrates that financial statement data used as the basis for stock selection is relevant to building portfolios that deliver better investment returns by reducing risk.
Analysis of financial statement data is the sole input to the algorithmic model that yielded the Fundamental Grade “A” performance shown in Figure 5 above. The model had no knowledge of stock price, analysts’ opinions, or other external data. The rules and holdings that generated the Fundament Grade “A” performance shown above is reproduceable and available to interested parties for their own evaluation. For more information, please visit our website at http://GAAPFundamentals.com
Disclosure
Valspresso is not a registered investment advisor, legal or tax advisor, or broker/dealer. Performance summary was generated by the Valspresso simulation system from 1/1/2010 to 9/30/2020. The Valspresso simulation utilizes a hypothetical reconstruction of how a specific account might have performed using the firm’s Fundamental Grade “A” classifier. Returns do not represent actual trading of a client’s assets but were achieved by applying a model. Returns do not include transaction cost, fees, and dividends. Simulated returns have inherent limitations, especially the fact that they do not represent actual trading.
The views and opinions expressed herein are the views and opinions of the author and do not necessarily reflect those of Nasdaq, Inc.