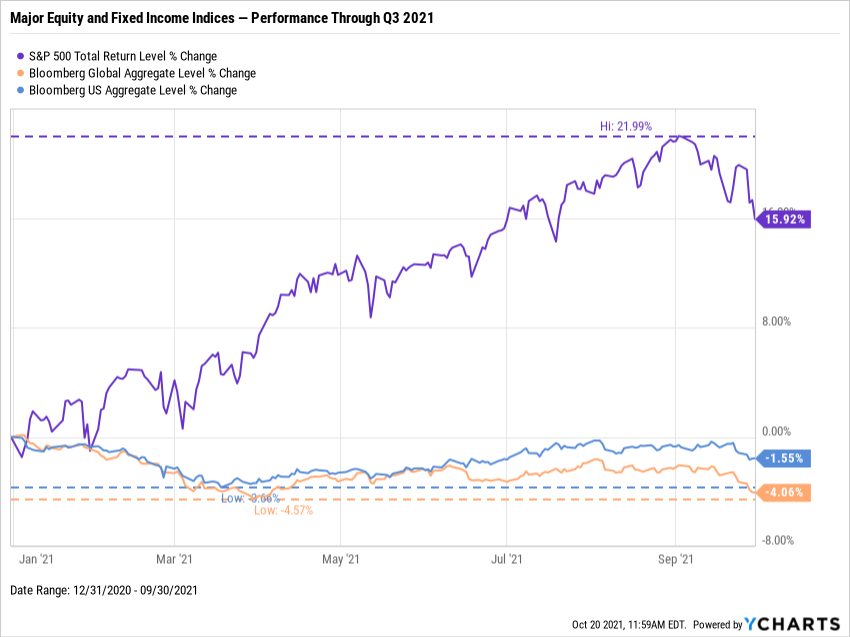
The chart below shows that through the end of Q3 2021, the S&P 500 (^SPXTR) was up 15.9% including dividends, the Bloomberg US Aggregate (^BBUSATR) fell 1.6%, and the Bloomberg Barclays Global Aggregate (^BBGATR) dropped about 4.1%. Mostly moving in tandem, US bonds diverged from their global counterpart in early Q3, refusing to go lower as global bonds hover near their 2021 lows.

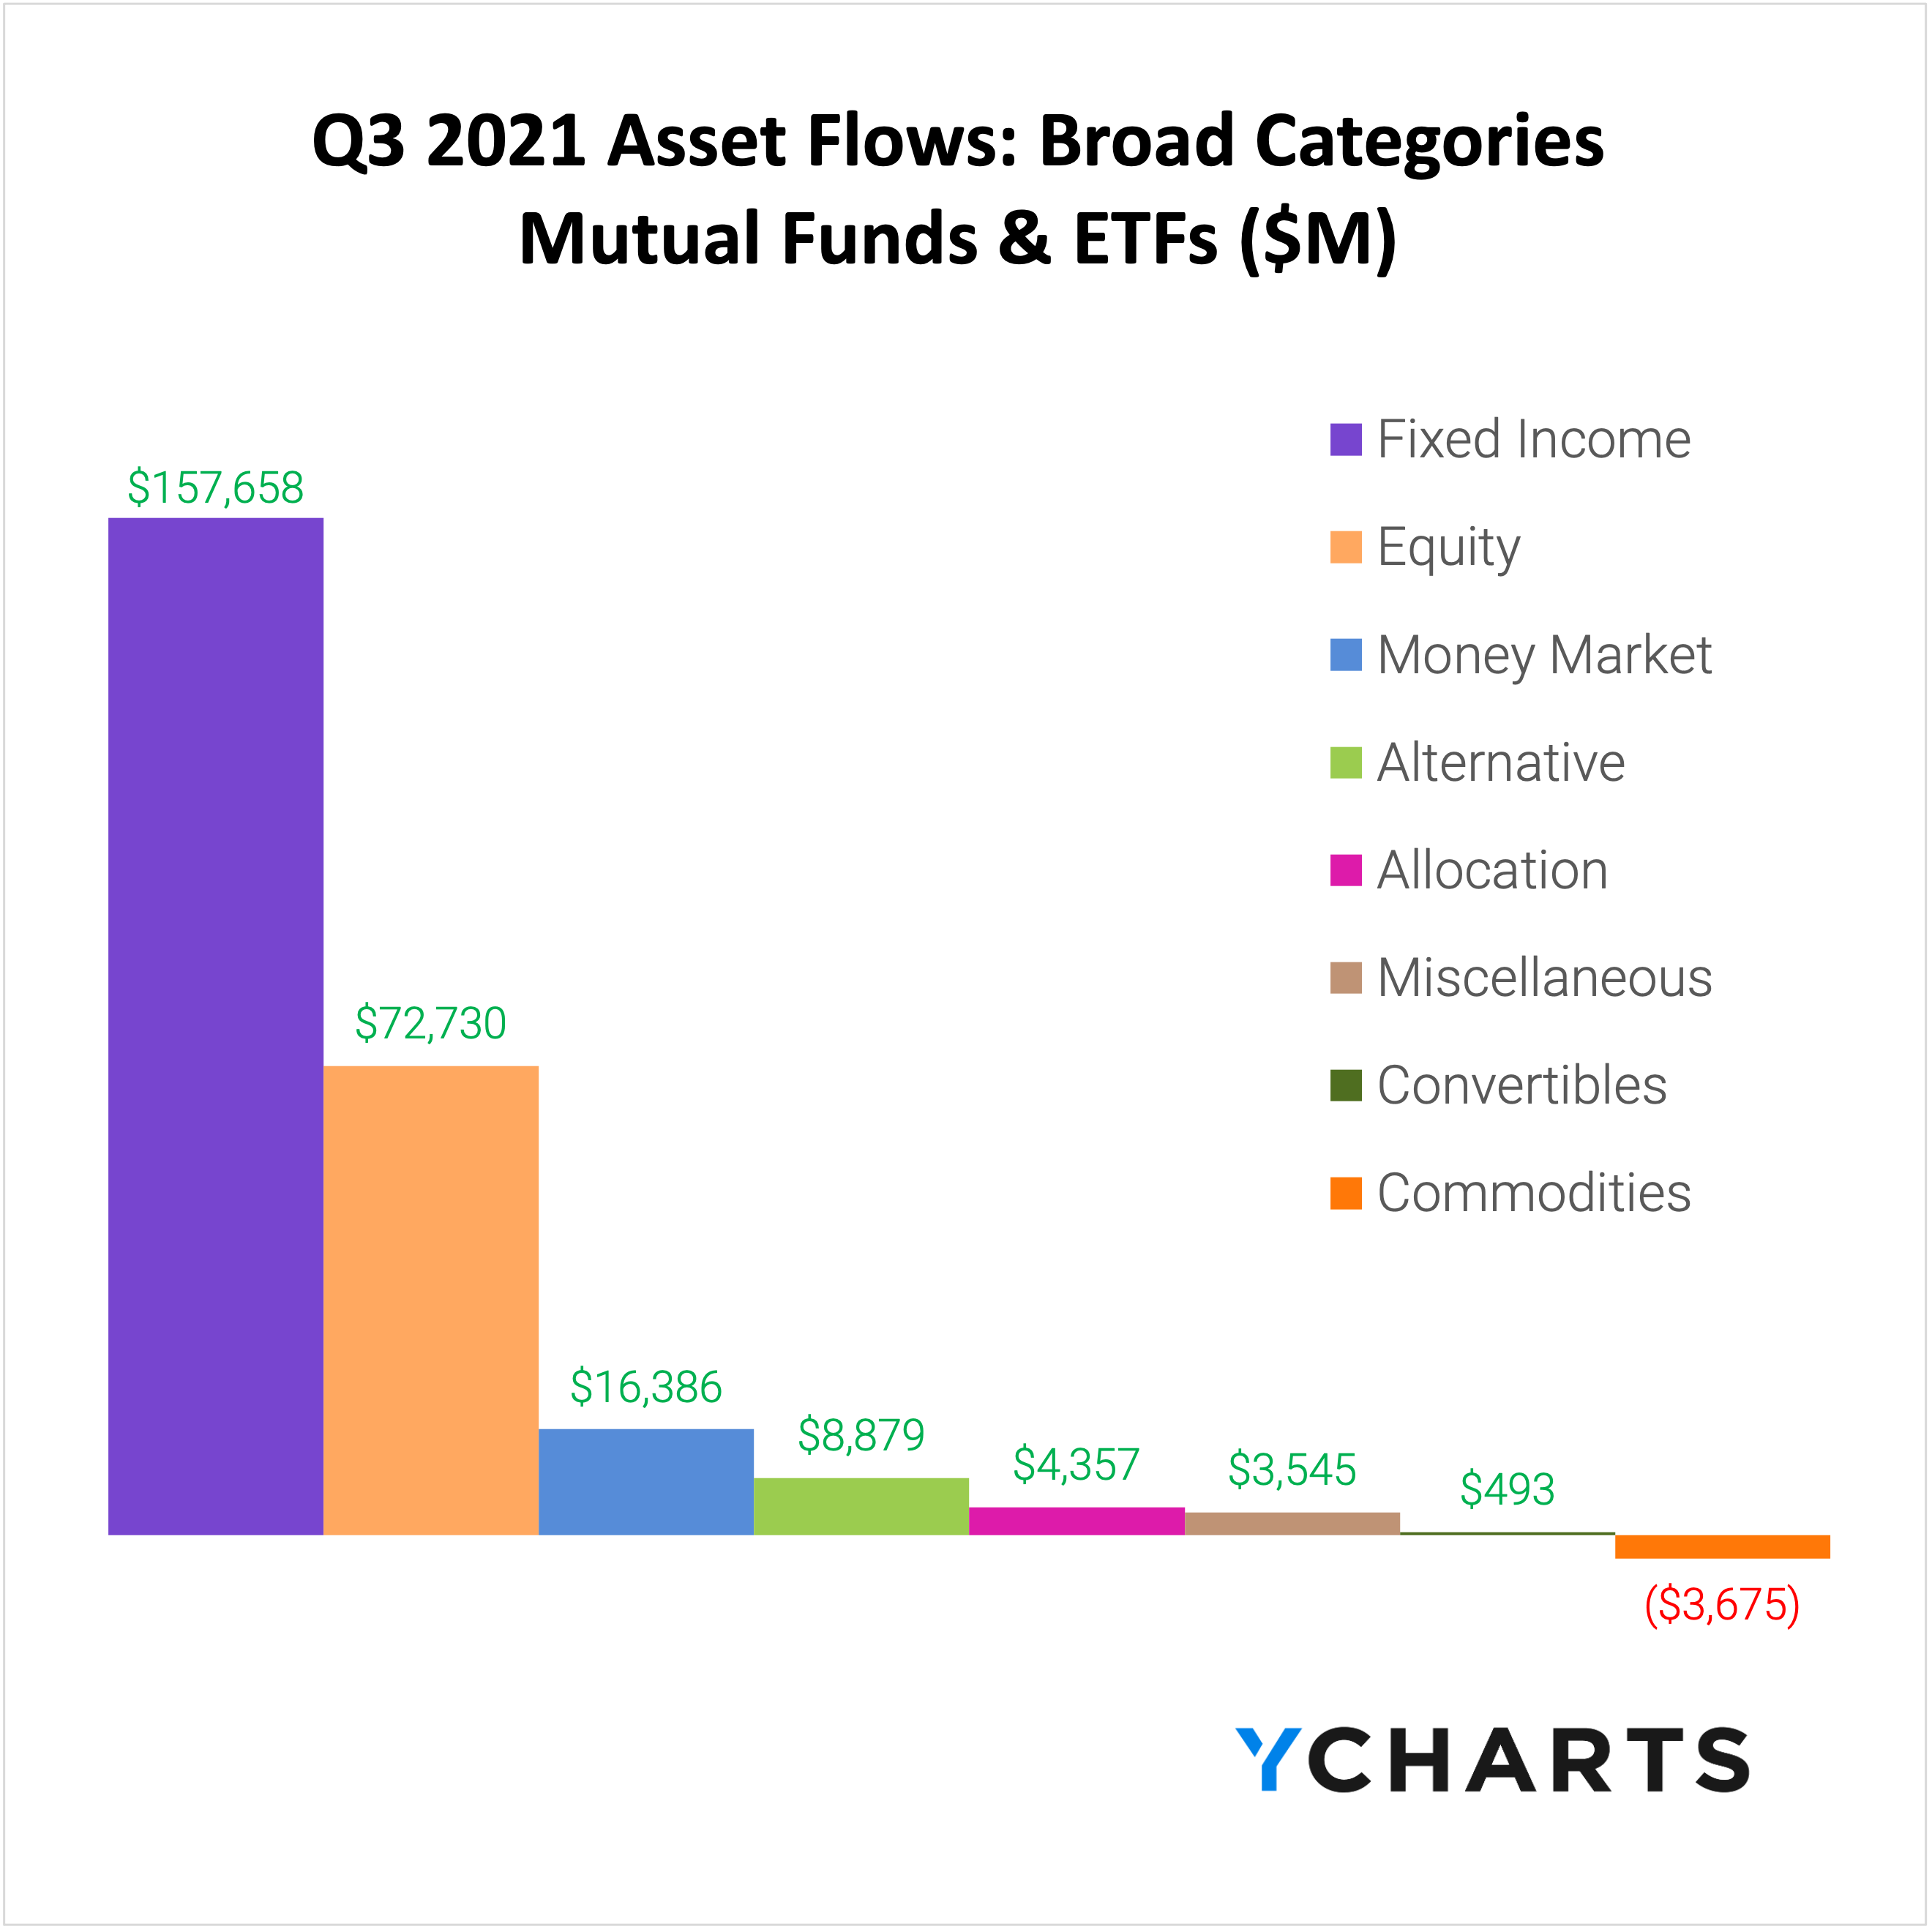
Despite the wide spread between equity and bond returns, fixed income funds attracted the most inflows of any broad category in Q3, adding $157.7 billion of assets compared to the $72.7 billion of fund flows that went into the equity category:

What can we learn from investors’ recent activity with mutual funds and ETFs? Are massive flows into fixed income funds, combined with a pullback in equity performance, just the early signals of a sustained bear market?
To answer these questions, we look to fund flows.
Fund flows are the net cash inflow into a fund (purchases) or net outflow from a fund (redemptions). Irrespective of fund performance, when a mutual fund or ETF has positive fund flows (or net issuances for ETFs) in a given period, that fund’s managers then have more cash to buy more holdings. The opposite is also true: as fund holders sell shares, fund managers sell out of positions and use the cash to pay redemptions.
This means that fund flow data can indicate higher or lower demand for different asset types, depending on which funds and categories have relatively large inflows or outflows.
Are you discussing fund flows with advisors and clients? Reach out to see how YCharts improves the quality and efficiency of your sales conversations.
Mutual Fund Flows: Biggest Winners And Losers
Foreign Large Blend mutual funds saw the most inflows in Q3 2021.
Even though their net asset flows total -$72 billion over the past year, ex-US large cap funds accumulated $22.7 billion in Q3, the most of any category in that period. Perhaps in need of a place to stockpile liquidity, investors also put another $16.4 billion into Money Market mutual funds. Money market funds, in addition to Short-Term Bond and Intermediate Core-Plus Bond funds, have been among the most popular mutual fund categories through each of 2021’s three quarters.

For the third consecutive quarter, investors pulled significant amounts of money out of Large Cap equity funds. Large Growth and Large Blend mutual funds lost $27.3 billion and $18.6 billion of assets in Q3, respectively, even as the Wilshire US Large-Cap Index was flat for the quarter. These two categories have the most net outflows among mutual funds over the past year, despite the S&P 500 rising nearly 16% YTD and their large cap ETF counterparts garnering positive one-year flows.

ETF Flows: Biggest Winners And Losers
Unlike the trend in mutual funds, Large Blend was the most popular ETF category in Q3. Domestic Large BlendETFs collected the most inflows of any ETF category, $48.4 billion, followed by $17.4 billion directed to Foreign Large Blend ETFs. Inflation-Protected Bonds and Short-Term Bond ETFs—two categories which led all mutual fund flows in Q2—benefited from inflation remaining above 5%. Investors placed another $10.9 billion of assets into Inflation-Protected Bond funds and $9.6 billion into Short-Term Bond funds amid growing concern about overheated equities.

ETF outflows were on the lighter side in Q3. The “biggest loser” was the Commodities Focused ETF category, from which investors withdrew $3.6 billion. Industrial sector ETFs posted a net-negative $2.5 billion outflow, while Mid-Cap Growth and Consumer Cyclical ETFs each lost $1.6 billion, potentially due to the supply chain disruptions which have resulted in lowered global growth forecasts.

Equity Style Fund Flows And Performance
The table below shows a summation of combined mutual fund and ETF fund flows, plus average category performance for the nine equity style boxes.
Among all equity style funds, the biggest winner and loser of Q3 were both of the Large Cap variety. Large-CapBlend took in $29.8 billion between both mutual funds and ETFs in Q3, while Large-Cap Growth saw outflows of $15.1 billion. Growth as a style did not fare well across small and mid-cap funds either, with Small-Cap Growthlosing $5.2 billion and Mid-Cap Growth $10.2 billion of assets, respectively.

All in all, investors were clearly dumping growth funds in Q3. Interestingly enough, there wasn’t a total shift from growth to value in the quarter, as value funds lost a net $4.4 billion of assets across large, mid, and small caps. As Large-Cap Blend attracted the most investor assets, $29.8 billion, the trend suggests investors currently desire some growth in their portfolio, but mixed with a proportionate level of value exposure.

Passive ETFs Continue Inflow Dominance Over Active ETFs
Last quarter, both active and passive funds saw net positive inflows, but passive ETFs were factors more popular than active ETFs. In Q3, that trend persisted.
Investors put $157.8 billion into passive ETFs, which is 13.3x the $11.8 billion of asset flows into active ETFs (in Q2, passive ETFs gained $197.8 billion, dwarfing the $20.5 billion of inflows put toward active ETFs). Active mutual funds, however, received $51.1 billion of net inflows compared to just $23.6 billion for passive mutual funds. These figures reinforce the growing consensus that investors prefer fee-efficient ETFs for passive investing, but still see value in the offerings of active mutual fund managers.

For active ETFs, ARK funds took the biggest beating in Q3. The ARK Innovation ETF (ARKK) lost $2.2 billion in assets, while the ARK Genomic Revolution ETF (ARKG) and ARK Next Generation Internet ETF (ARKW) each saw $800 million in outflows as growth fell out of favor for most of Q3.
On the passive ETFs side, investors leaned toward “owning the market” through S&P 500 ETFs in addition to broad stock market indices as part of the shift to large-cap blend. The Vanguard S&P 500 index (VOO) and SPDR S&P 500 ETF Trust (SPY) gained $14.0 billion and $8.1 billion of respective inflows, while investors sent $11.5 billion of assets to the Vanguard Total Stock Market ETF (VTI).
Investors Shift to Value, but Keep Some Growth on Hand
The goal of analyzing fund flows is to uncover insights about investor sentiment. So what does the Q3 2021 data reveal?
Investors left growth funds in large numbers, but weren’t ready to dive fully in the waters of value funds. Hence, blend funds—namely the Large-Cap Blend style—proved a suitable solution for many fundholders in Q3.
This move toward whole-market equity exposure is taking place against the backdrop of rising concerns that stocks are due for a pull back. Fixed income and money market funds, though not market leaders in terms of performance, have been attractive options as investors second-guess their allocations.
Are you discussing fund flows with advisors and clients? Reach out to see how YCharts improves the quality and efficiency of your sales conversations.
For further analysis on what this quarter’s asset swings mean for markets, watch our 5-minute Q3 Fund Flows recap here:
Connect with YCharts
To learn more, schedule time to meet with an asset management specialist, call us at (773) 231-5986, or email hello@ycharts.com.
Want to add YCharts to your technology stack? Sign up for a 7-Day Free Trial to see YCharts for yourself.
Disclaimer
©2021 YCharts, Inc. All Rights Reserved. YCharts, Inc. (“YCharts”) is not registered with the U.S. Securities and Exchange Commission (or with the securities regulatory authority or body of any state or any other jurisdiction) as an investment adviser, broker-dealer or in any other capacity, and does not purport to provide investment advice or make investment recommendations. This report has been generated through application of the analytical tools and data provided through ycharts.com and is intended solely to assist you or your investment or other adviser(s) in conducting investment research. You should not construe this report as an offer to buy or sell, as a solicitation of an offer to buy or sell, or as a recommendation to buy, sell, hold or trade, any security or other financial instrument. For further information regarding your use of this report, please go to: ycharts.com/about/disclosure
The views and opinions expressed herein are the views and opinions of the author and do not necessarily reflect those of Nasdaq, Inc.
