A Special Purpose Acquisition Company (SPAC) is a shell company, without its own business operations, that goes public in order to someday acquire an operating company. The deal structure has become exponentially popular since 2019, with big names like Chamath Palihapitiya, Shaquille O’Neal, Betsy Cohen, and Alex Rodriguez all joining the SPAC party.
But why should you care? After all, SPACs are just a vehicle through which private investors bring companies to public markets.
Well, our recent study found that SPACs’ unique structure and timeline can affect future share performance, introducing both risks and opportunities for advisors and investors who are interested in early-stage companies.
To help you understand the SPAC lifecycle—from IPO, to merger announcement, through merger closing and beyond—we studied a sample of SPACs that successfully took a company public and how their shares performed pre- and post-merger.
Included in the guide are free-to-download visuals that can be easily shared with your clients and colleagues. Each finding and visual is data-driven and unbiased, but they are not meant to serve as investment advice.
Here’s a preview of what’s inside:
SPACs live up to a key perceived benefit: time savings
SPACs have their pros and cons for every party involved, but a key favorable element for companies that merge with SPACs is time to public listing.
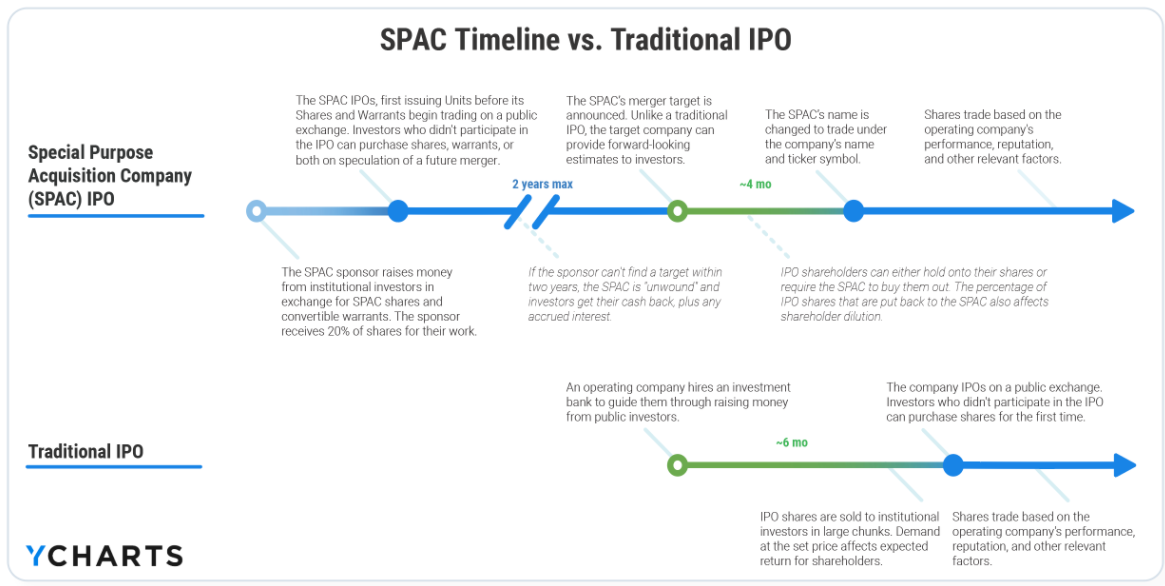
The perceived time savings compared to a traditional IPO have contributed to the rise of SPACs—for the 72 companies included in this study, a median 4.1 months elapsed between the initial SPAC-company merger announcement and the announcement of its closing. For traditional IPOs, the process is often quoted to take around 6 months.

SPAC performance varies across lifecycle stages
We focused on the lifetime performance of 72 SPACs that successfully merged with an operating company. In other words, they’ve completed the full, intended SPAC lifecycle. This way, we can better determine whether SPACs are suitable long term investments and if, once shares are converted, operating companies are at all affected by their SPAC origins.
The three SPAC lifecycle stages examined are:
-
SPAC IPO to the announcement of a Definitive Merger Agreement
-
Announcement of a Definitive Merger Agreement to Announcement of Completed Merger
-
Announcement of Completed Merger to Present (through February 2021)
This flowchart illustrates how SPACs swayed between underperforming and outperforming the S&P 500. It appears that performance is strongest after a SPAC announces its merger target, but before that merger is actually completed—signaling that investing on speculation and “hype” is often rewarded, if only temporarily.
To SPAC-ulate, or not?
Our study intentionally focused only on SPACs that completed mergers, of which there have been 188 in total since 2009. In the same period, 474 SPACs have IPO’d on public markets, meaning ~60% didn’t or haven’t yet successfully courted an operating company. If you’re investing in pre-merger SPACs on SPAC-ulation, that stat may be worrisome.
That said, SPACs provide a different structure for going public than traditional IPOs or direct listings, but nonetheless give the average investor access to companies they otherwise couldn’t invest in, which sounds like a positive for most.
Connect With YCharts
To get in touch, contact YCharts via email at hello@ycharts.com or by phone at (866) 965-7552
Interested in adding YCharts to your technology stack? Sign up for a 7-Day Free Trial.
Disclaimer
©2021 YCharts, Inc. All Rights Reserved. YCharts, Inc. (“YCharts”) is not registered with the U.S. Securities and Exchange Commission (or with the securities regulatory authority or body of any state or any other jurisdiction) as an investment adviser, broker-dealer or in any other capacity, and does not purport to provide investment advice or make investment recommendations. This report has been generated through application of the analytical tools and data provided through ycharts.com and is intended solely to assist you or your investment or other adviser(s) in conducting investment research. You should not construe this report as an offer to buy or sell, as a solicitation of an offer to buy or sell, or as a recommendation to buy, sell, hold or trade, any security or other financial instrument. For further information regarding your use of this report, please go to: ycharts.com/about/disclosure.
This article was originally published by YCharts.
The views and opinions expressed herein are the views and opinions of the author and do not necessarily reflect those of Nasdaq, Inc.
