Gaining Deeper Insight into Private Equity Value Creation with IRR Attribution Analysis
The Internal Rate of Return (IRR) has several well documented issues but remains the most commonly used measure of private market performance.
One of the most commonly cited issues relates to how early strong performance can ‘bake in’ a good long-term performance, as shown in figure 1. For managers with long track records, their historic deals or funds can significantly influence the total track record IRR. Another issue relates to the size of the deal – the larger the deal the greater the influence on the total performance.
This can make it challenging for investors to compare manager performance on a like-for-like basis and, importantly, understand the factors that influenced the returns.

Figure 1. The impact of timing on IRR
To combat these issues, the most sophisticated investors are increasingly using iterations of the IRR calculation: Zero Based IRRs, Neutrally Weighted IRRs and Neutrally Weighted & Zero Based IRRs. The ability to calculate these IRRs is a key feature of the Nasdaq eVestment™ platform.
But what is the definition of each, how do they work and how can they be used to gain a deeper insight into the drivers of performance?
IRR Calculation Overview

Zero Based IRR
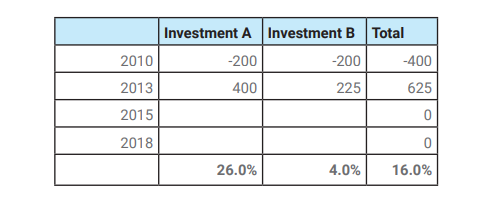
Zero Based IRR combats the timing effect of deals on IRRs. Zero Basing (also known as time zero) the cash flows assumes all deals to have commenced on the same day. In figure 2., if both investment A and B were to have commenced in 2010, the total performance is measured over just three years and the Zero Based IRR is just 12.3% versus 16.4% as seen in figure 1.

Neutrally Weighted IRR
Neutrally Weighted IRR removes bias of deal size in IRR calculation. It is very rare for all deals in a private equity fund to be the same size exactly and therefore, how much is invested in each deal can also influence the total IRR. If the best performing deal is also the largest deal this will lead to a better total IRR than if the best performing deal is the smallest deal and vice versa. To combat this ‘stock picking effect’ it is possible to re-weight the cash flows so in effect all deals are assumed to have been the same size. If we take the example in Figure 1. and reweight so that Investment A was the same size as Investment B, then while the individual IRRs remain unchanged, the total IRR rises from 16.4% to 20.6%.

Neutrally Weighted & Zero Based IRR
Finally, both calculations can be combined so in effect all deals are assumed to be the same size and have commenced on the same date. If this applied to the example in Figure 1. then the total IRR reduces from 16.4% to 16.0%.
Interpreting the Results of IRR Attribution Analysis
The attribution of managers’ performance can be achieved by cross-comparing the results of the IRRs to produce an assessment of the Timing Impact, Selection Impact and, therefore in combination, the Manager Contribution to the total return.
While these calculations can help identify the drivers of performance, it is worth noting that neither the timing of investments or their relative sizes are entirely within the control of the manager. Therefore, these results should be viewed as part of the track record analysis process and not a singular approach to manager selection. Good track record analysis is about digging behind the numbers and identifying areas for further investigation. The above attribution analysis aids greatly in this endeavour.

Calculating performance with TopQ+
These new attribution calculations are available in Nasdaq eVestment TopQ+, part of the Nasdaq eVestment platform, further expanding the fund analytics capabilities for investors and fund managers.
Nasdaq eVestment TopQ+ is purpose-built to meet the needs of LPs and GPs. Move beyond Excel and capitalize on the power, security and efficiencies of a tool purpose-built for the private markets.
The views and opinions expressed herein are the views and opinions of the author and do not necessarily reflect those of Nasdaq, Inc.
