ETFG ETFGI Reports ETFs Industry in Europe Gathered $11.85 Billion of Net Inflows in February 2022
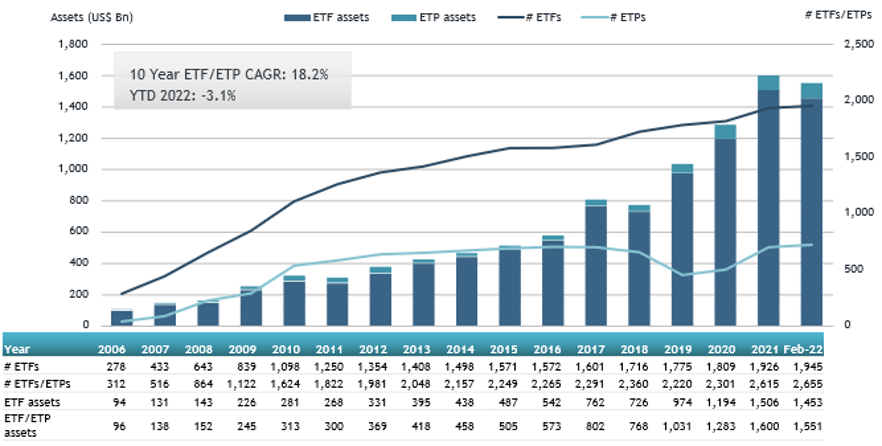
LONDON —March 18, 2022 — ETFGI, a leading independent research and consultancy firm covering trends in the global ETFs and ETPs ecosystem, reported today that the ETFs industry in Europe gathered US$11.85 billion in net inflows in February 2022, bringing year to date net inflows to US$40.91 billion. At the end of the month, assets invested in the European ETFs industry decreased by 1.2%, from US$1.57 trillion at the end of January, to US$1.55 trillion, according to ETFGI's February 2022 European ETFs and ETPs industry landscape insights report, the monthly report which is part of an annual paid-for research subscription service. (All dollar values in USD unless otherwise noted.)
- ETFs industry in Europe gathered $11.85 billion of net inflows in February 2022.
- YTD net inflows of $40.91 Bn are the second highest on record, after YTD net inflows in 2021 of $41.91 Bn.
- $192.63 Bn net inflows gathered in the past 12 months.
- 23rd month of consecutive net inflows.
- Assets of $1.55 Tn invested in ETFs and ETPs listed in Europe at the end of February.
- Assets decreased 3.1% YTD in 2022, going from a record $1.60 Tn at the end of 2021, to $1.55 Tn.
- Equity ETFs and ETPs listed in Europe gathered $32.08 Bn in YTD net inflows 2022 are the highest on record.
“The S&P 500 decreased by 2.99% in February as the world watches the situation in the Ukraine unfold. Developed markets excluding the US, experienced a loss of 1.34% in February. Japan (down 0.59%) and Portugal (down 0.62%) experienced the smallest losses amongst the developed markets in February, while Austria suffered the largest loss of 10.92%. Emerging markets decreased by 3.43% during February. Peru (up 7.07%) and UAE (up 6.02%) gained the most while Russia (down 50.32 %) and Hungary (down 24.63 %) witnessed the largest declines. S&P Dow Jones announced the removal of all stocks domiciled and listed in Russia due to the country’s invasion of Ukraine.” According to Deborah Fuhr, managing partner, founder and owner of ETFGI.
Europe ETFs and ETPs asset growth as at the end of February 2022

The ETFs industry in Europe had 2,655 products, with 10,497 listings, assets of $1.55 Tn, from 90 providers listed on 29 exchanges in 24 countries at the end of February.
During February 2022, ETFs/ETPs gathered net inflows of $11.85 Bn. Equity ETFs/ETPs gathered net inflows of $7.14 Bn over February, bringing year to date net inflows to $32.08 Bn, higher than the $29.68 Bn in net inflows equity products had attracted at this point in 2021. Fixed income ETFs/ETPs had net inflows of $860 Mn during February, bringing net inflows for the year through February 2022 to $3.65 Bn, much lower than the $8.53 Bn in net inflows fixed income products had attracted by the end of February 2021. Commodities ETFs/ETPs reported net inflows of $2.35 Bn during February, bringing net inflows for the year through February 2022 to $3.89 Bn, higher than the $2.85 Bn in net inflows commodities products had reported year to date in 2021. Active ETFs/ETPs attracted net inflows of $744 Mn over the month, gathering net inflows year to date of $874 Mn, higher than the $21 Mn in net outflows active products had reported in the first two months of 2021.
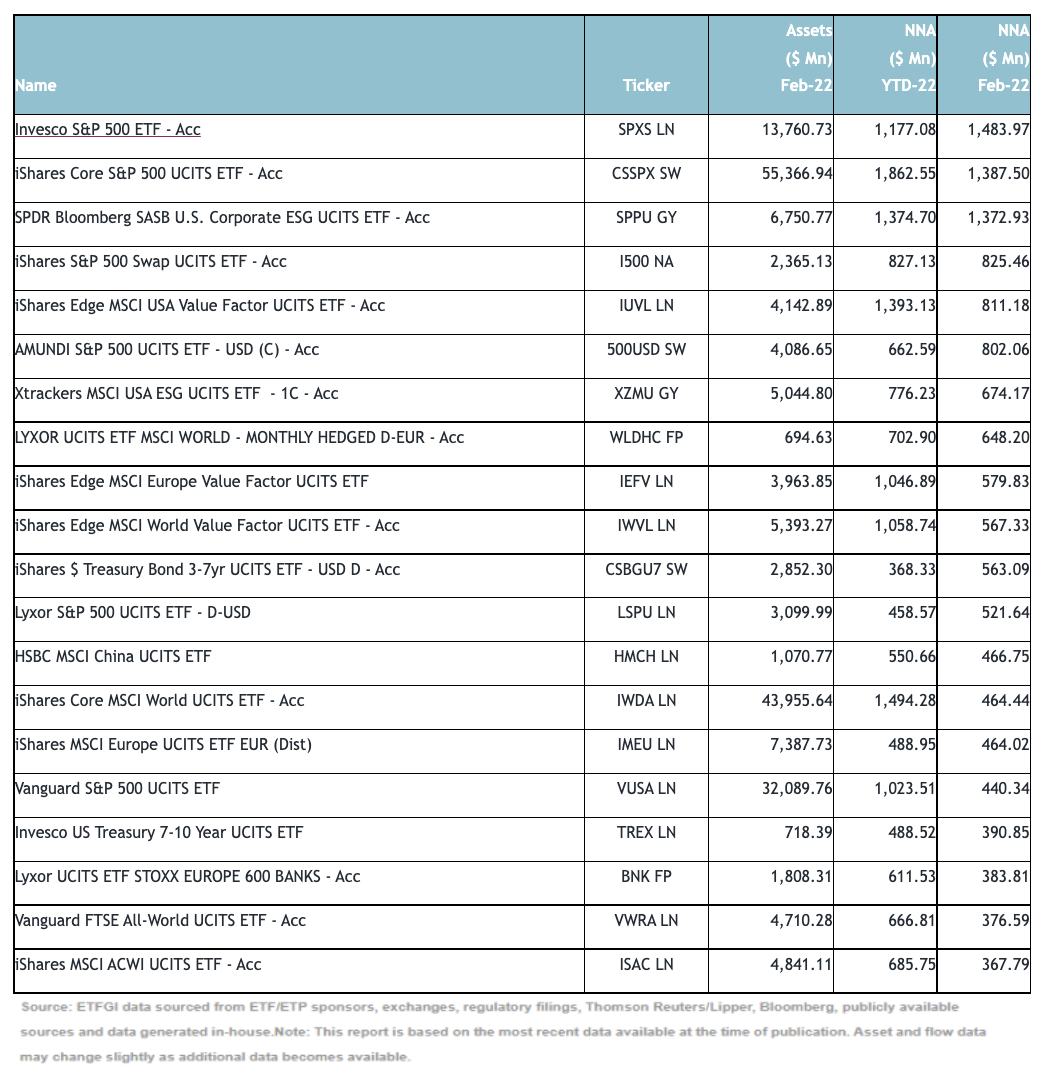
Substantial inflows can be attributed to the top 20 ETFs by net new assets, which collectively gathered $13.59 Bn during February. Invesco S&P 500 ETF - Acc (SPXS LN) gathered $1.48 Bn, the largest individual net inflow.
Top 20 ETFs by net inflows in February 2022: Europe

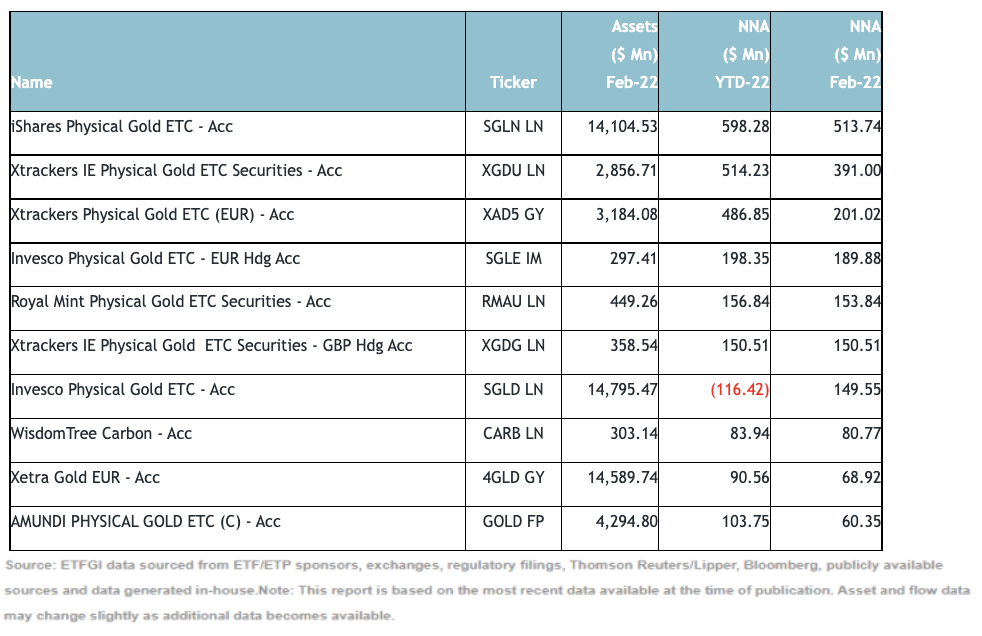
The top 10 ETPs by net new assets collectively gathered $1.96 Bn during February. iShares Physical Gold ETC - Acc (SGLN LN) gathered $514 Mn, the largest individual net inflow.
Top 10 ETPs by net inflows in February 2022: Europe

Investors have tended to invest in Equity ETFs and ETPs during February.
Contact deborah.fuhr@etfgi.com if you have any questions or comments on the press release or ETFGI events, research or consulting services.
The views and opinions expressed herein are the views and opinions of the author and do not necessarily reflect those of Nasdaq, Inc.
