The green flag continued flying for the bull market in Q2 of 2021, as investors continued to load up on assets of all types.
With most of the country fully reopened thanks to improving coronavirus vaccination rates, US markets continued their climb. The Dow and S&P 500 gained 5.1% and 8.5%, respectively, but a marketwide sector rotation back into growth drove the NASDAQ 9.7% higher in Q2.
Though market waters feel extraordinarily calm, keeping tabs on the latest trends and economic data is crucial to successfully managing an investment portfolio and educating clients.
Below are a few takeaways from the YCharts Q2 2021 Economic Update. The deck, published quarterly, arms advisors and investors with key insights from the previous quarter to help you make smarter investment decisions going forward. Furthermore, the deck is easily customizable with your own firm branding to be leveraged in client communications.
For a full review of the quarter, be sure to join us Wednesday, August 4th as we break down the major economic and market trends from Q2 2021, including how to white-label the Economic Summary Deck as your own for presenting to clients and prospects.
YCharts users can find the full deck in the Support Center. Not a current client? Reach out to get access.
Asset Class Performance
Every asset class in the table below posted positive gains in Q2 — even Aggregate Bonds, US Treasuries, and Municipal Bonds, which failed to do so in the first quarter of 2021. These instruments were the relative laggards, however, rising 1.8%, 1.7%, and 1.4%, respectively.
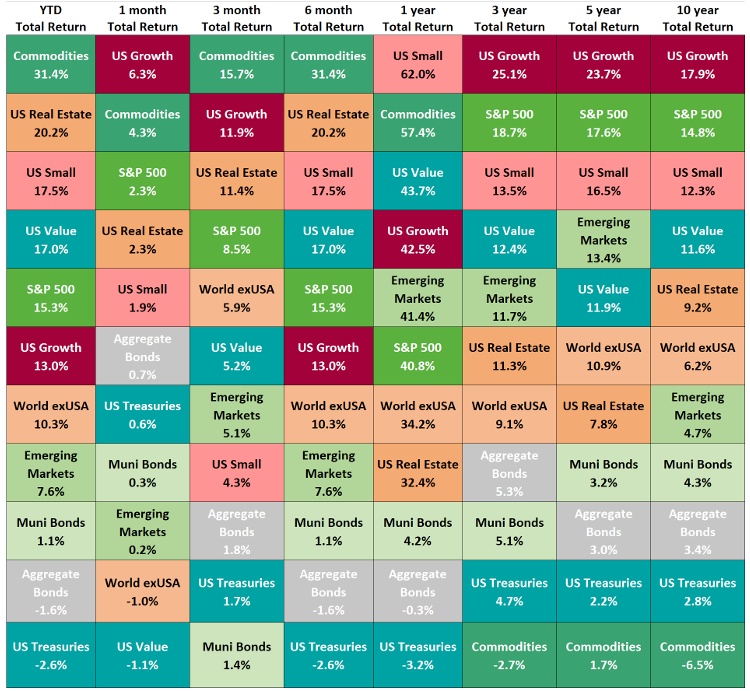
Commodities led the charge for a second straight quarter, adding 15.7%. In Q1, US Value rose 11.3% as investors rotated out of growth and into value names, but in Q2 it was US Growth’s 11.9% bump that stole back the show. US Real Estate had another strong quarter, adding 11.4% in addition to its 7.9% gain from Q1.
The “Buffett Indicator” Sounds Off
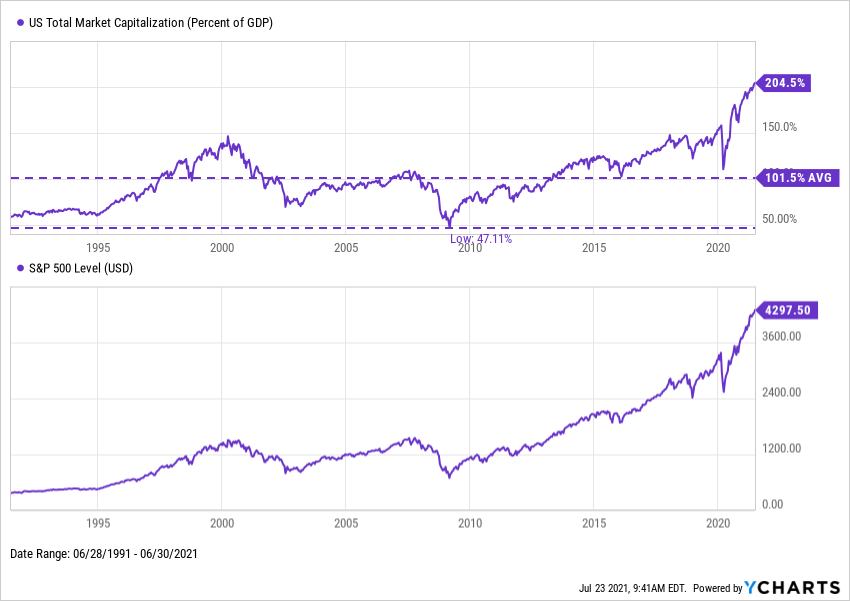
Warren Buffett once dubbed the ratio of US Total Market Capitalization to US GDP as “the best single measure of where valuations stand at any given moment”. At the end of Q2, US Total Market Cap stood at 204.5% of GDP, the ratio’s highest level in history.
Download Visual | Modify in YCharts
The Buffett Indicator is currently more than double its historical 1:1 average, indicating the US market is relatively overvalued. In March 2000, the Buffett Indicator reached a record 142.9%, a high watermark that was not breached again until January 2018. That level was tested several times throughout 2018 and 2019, eventually peaking at 158.3% in February 2020 before the coronavirus pandemic sent markets plummeting. After soaring to an unprecedented 200% in Q2 of 2021, the question going forward is: can US market valuations remain this high?
Crypto Assets Come Back Down to Earth
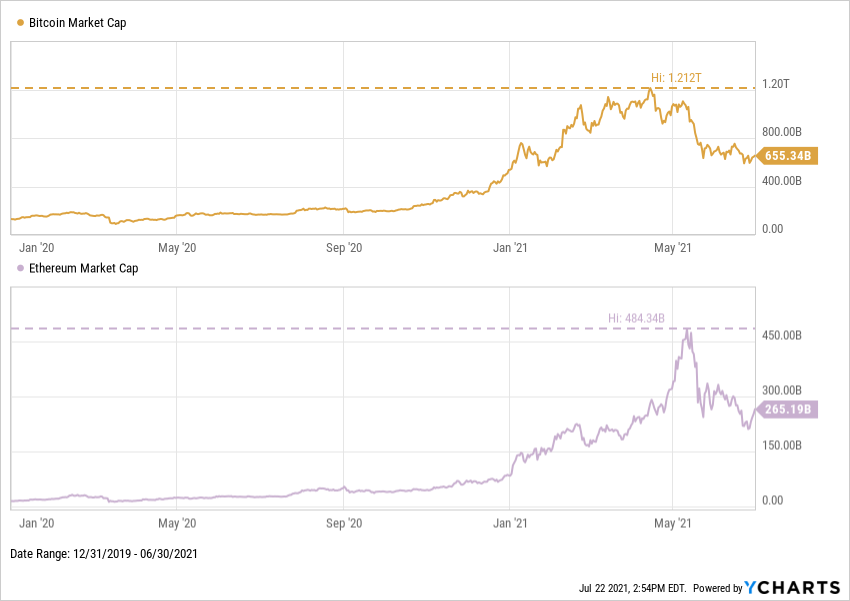
Crypto-assets rode a major wave in Q1, with Bitcoin joining the $1T market cap club in February. The popular crypto-asset’s market cap reached a high of $1.21T on April 14th— double that of Berkshire Hathaway (BRK.B)—only to be cut in half by the end of June.
Download Visual | Modify in YCharts
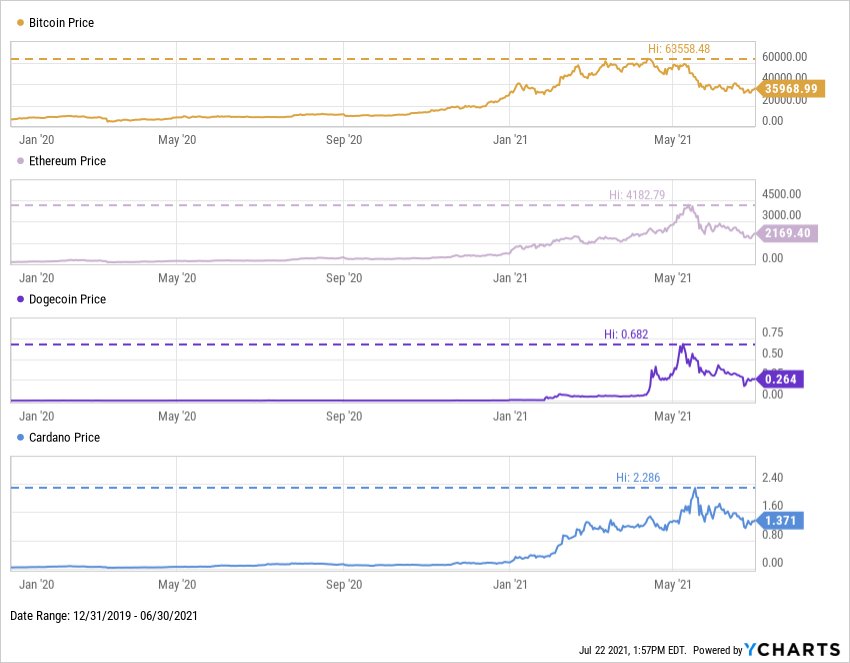
Other crypto-assets including Ethereum, Cardano, and Dogecoin suffered similar fates. Cardano ended Q2 down 40% from its all-time high, while the almighty Dogecoin is 61.4% off from its May 8th peak. Whoever watched Saturday Night Live that fateful day is probably still wondering whether or not self-proclaimed “Dogefather” Elon Musk can resuscitate the canine-themed digital asset.
Download Visual | Modify in YCharts
YCharts users—download the full deck in the Support Center. Not a current client? Reach out to get access.
Connect with YCharts
To get in touch, contact YCharts via email at hello@ycharts.com or by phone at (866) 965-7552
Interested in adding YCharts to your technology stack? Sign up for a 7-Day Free Trial.
Disclaimer
©2021 YCharts, Inc. All Rights Reserved. YCharts, Inc. (“YCharts”) is not registered with the U.S. Securities and Exchange Commission (or with the securities regulatory authority or body of any state or any other jurisdiction) as an investment adviser, broker-dealer or in any other capacity, and does not purport to provide investment advice or make investment recommendations. This report has been generated through application of the analytical tools and data provided through ycharts.com and is intended solely to assist you or your investment or other adviser(s) in conducting investment research. You should not construe this report as an offer to buy or sell, as a solicitation of an offer to buy or sell, or as a recommendation to buy, sell, hold or trade, any security or other financial instrument. For further information regarding your use of this report, please go to: ycharts.com/about/disclosure
The views and opinions expressed herein are the views and opinions of the author and do not necessarily reflect those of Nasdaq, Inc.

YCharts
YCharts
YCharts combines comprehensive data with powerful tools and outstanding customer support to enable clients to develop and visually communicate unique insights, make smarter investment decisions, and save significant time. YCharts is the one-stop shop for equities, mutual funds, ETFs, economic indicators, and market data.
Read YCharts' Bio%20After-Hours%20Quotes%20%7C%20Nasdaq&_biz_n=0&rnd=45097&cdn_o=a&_biz_z=1740069014067)

