
Dividend Growth: A Catalyst for Long-Term Capital Appreciation
- By Patrick Wolf & Animesh Jain
The Power and Peril of Dividend Investing
Identifying the long-term value of a security is at the heart of all equity portfolio construction, but the method employed varies greatly. While stock valuation models are as diverse as they are numerous, there is no denying the beneficial impact of capital returned to shareholders via dividends. In comparing the long-run returns of equities, the capacity for consistent dividend-paying companies to outperform their larger peer group is made clear. Such comparisons require an analysis beyond the movement in stock price to include a holistic view of return on investment. By incorporating returns of capital via dividends into the broader investment decision paradigm, investors can unlock the alpha-generating power of securities that adhere to a regiment of consistently growing dividends.
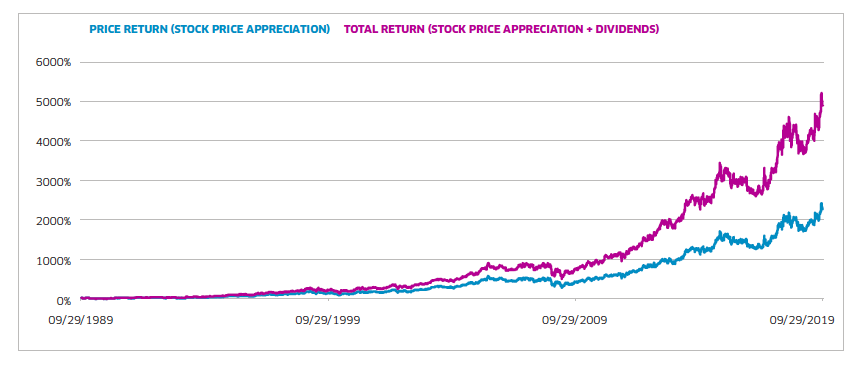
To illustrate the importance of dividends for long-term investors, the chart below compares the 30-year returns of Brown-Forman Corporation., with and without including the impact of dividends on returns. Throughout this period, Brown-Forman unfailingly paid a quarterly dividend while increasing the amount paid every calendar year. The result is a tremendous stock price return made extraordinary with the inclusion of dividends.
As exceptional as those dividend-driven returns may be, paying dividends requires a company to direct capital away from day-to-day operations. For many companies, this paying of dividends does not adversely affect their ability to undertake vital activities such as servicing debt, procuring goods and services, and paying employees. However, all companies are susceptible to cutting or canceling their dividend program when facing significant financial duress. Financial duress can be specific to a company or sector, such as the fallout from the oil supply glut in 2014-2016, or reflective of a wider economic downturn, such as the nadir of the financial crisis in 2008-2009.1,2 When companies cut or cancel their dividend program, the result is a significant loss in short and long-term shareholder value. The immediate fallout is typically a sharp decline in price. Many companies subsequently take years to stabilize their dividend payment strategies, if indeed they ever do.
A Fundamental Approach to Dividend Growth
In order to capture the alpha-generating impact of dividends while avoiding the pitfalls of dividend cuts and cancellations, dividend-oriented portfolio construction must take into account a wide array of factors to ensure the securities selected exhibit a past commitment and present financial capacity to consistently grow their dividend payments. The Nasdaq Victory Dividend Accelerator Index (NQVDIV) seeks to create a diversified portfolio of securities that are forecasted to grow dividends based on a combination of historical dividend growth and various financial metrics.
The Index applies 15 factors with a 10-year look back to all Nasdaq US Large Mid Cap Index (NQUSBLM) securities that paid a dividend during the evaluation period.3

These factors serve as the independent variables in a logit regression model that scores and ranks the input components. Having evaluated the historical impact of these factors on dividend growth, the Index assigns scores to the current universe of securities based on their underlying factor data. The result is a portfolio of 75 US securities that are willing and able to drive value to investors through consistent year-on-year dividend growth.
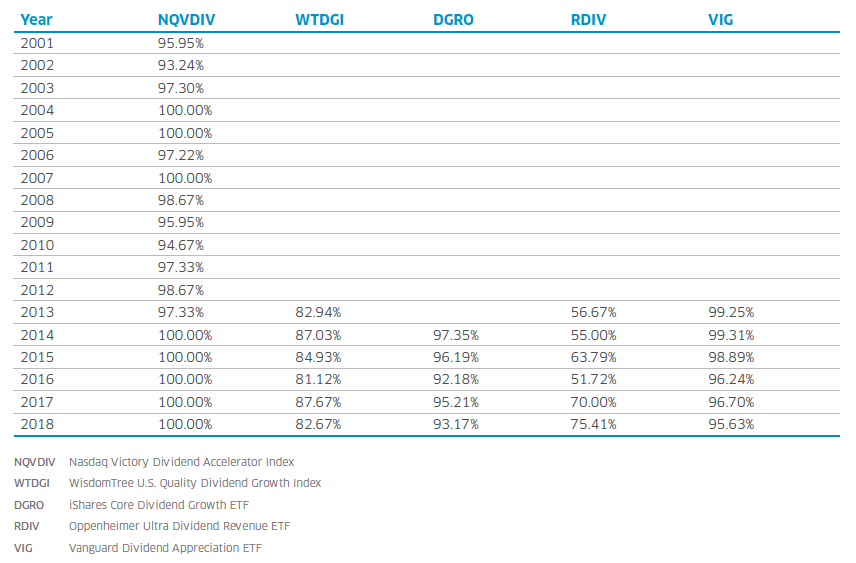
The table below shows the “Hit Rate” at which NQVDIV components grew their trailing twelve month dividend payments year-on-year. The NQVDIV index maintained an elite level of dividend growth for more than 15 years, including two extraordinary market downturns in the fallout from the Tech Bubble and the Financial Crisis. Ultimately, the NQVDIV methodology proved consistent and resilient in its capacity to identify dividend-growing securities.
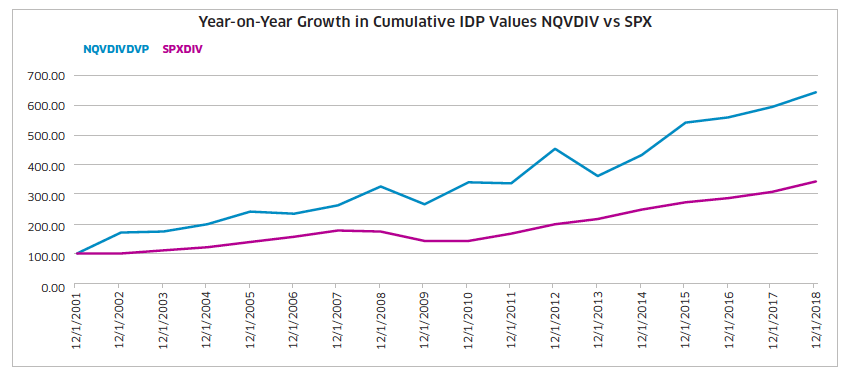
To illustrate how this successful hit rate affects the investor experience, the chart below tracks the cumulative growth in the Index Dividend Point values associated with the NQVDIV Index. The Index Divided Point values are a means of mathematically normalizing the impact of dividends paid out by index components. Given differences in share price across index components, the absolute value of dividends paid by each company on a per share basis does not accurately reflect the realized dividend-driven returns. The Index Dividend Point value weights the magnitude of dividends paid out in a manner that is reflective of each index component’s position within the index. Relative to the S&P 500 Index, the NQVDIV Index has realized a higher level of IDP growth year-to-year and on a cumulative basis, thus delivering a superior level of dividend-driven return.
Tactical Allocation Within Dividend Growth
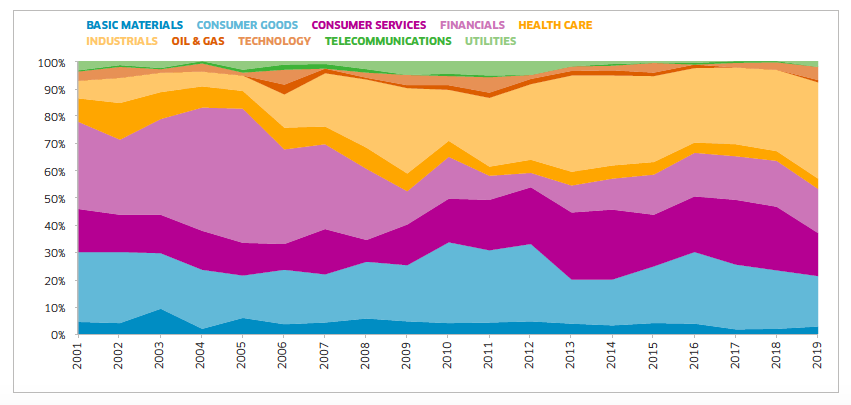
In addition to the superior dividend-driven returns, the focus on underlying fundamentals in the components selection process generates a far more dynamic allocation than is typical of dividend-growth indexes. Many dividend-growth indexes utilize an inductive process of blindly selecting all securities that have grown their dividend payments, which neglects the industry-specific challenges facing particular companies. The NQVDIV Index, through an in-depth multi-factor analysis, deduces which companies are in the best financial position to grow their dividend payments without imperiling their business. As evidenced by the chart below, the Index offers a tactical sector allocation that reflects the ever-changing outlook facing a given industry.
A final differentiating element of the NQVDIV Index is its nuanced weighting scheme. The 75 index components are derived from three buckets:
- Bucket 1: the top 50 scoring securities with 20+ years of dividend growth
- Bucket 2: the top 15 scoring securities with 10-19 years of dividend growth
- Bucket 3: the top 10 scoring securities with 5-9 years of dividend growth
The index aims to create a broader approach to identifying value in dividend growth by avoiding a bias towards securities that have grown their dividends for multiple decades. In general, as publicly traded companies mature, they place a greater emphasis on return of capital to shareholders. Simply put, older companies face greater challenges finding viable investment opportunities. With one third of its components having grown their dividends for less than 20 years, the NQVDIV Index provides exposure to companies all across the business maturation spectrum. Moreover, the Index employs a tiered weighting scheme in order to optimize these differences. All securities are weighted by a combination of dividend yield and 10-year net income stability. These two factors are combined to derive a weight for each security in a manner specific to the bucket that the security falls into:
- Bucket 1: 75% dividend yield and 25% 10-year net income stability
- Bucket 2: 50% dividend yield and 50% 10-year net income stability
- Bucket 3: 25% dividend yield and 75% 10-year net income stability
For securities that have been growing their dividend for multiple decades, the Index takes advantage of their long history of prudent dividend policy by maximizing exposure to dividend yield. In evaluating securities with more abbreviated dividend growth track records, the Index emphasizes greater stability in profit growth and the price appreciation that typically coincides. This highly targeted weighting scheme is emblematic of the NQVDIV Index’s capacity to identify value that can be neglected when one fails to look beyond the number of years of continuous dividend growth.
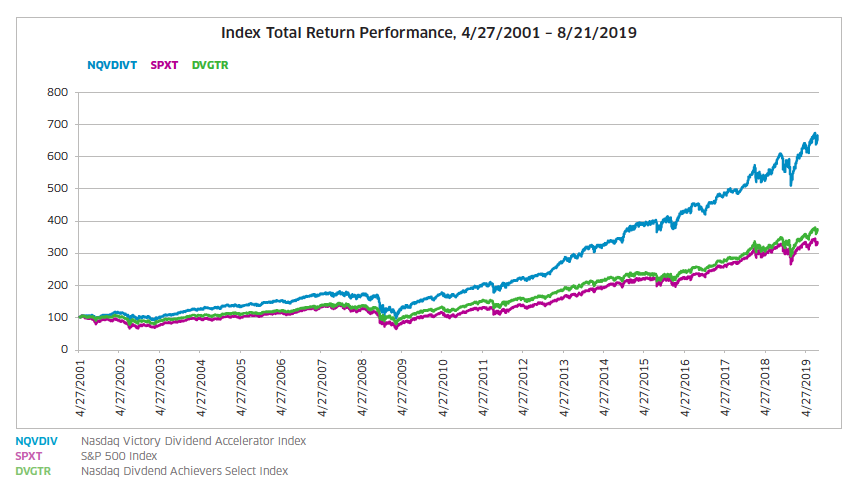
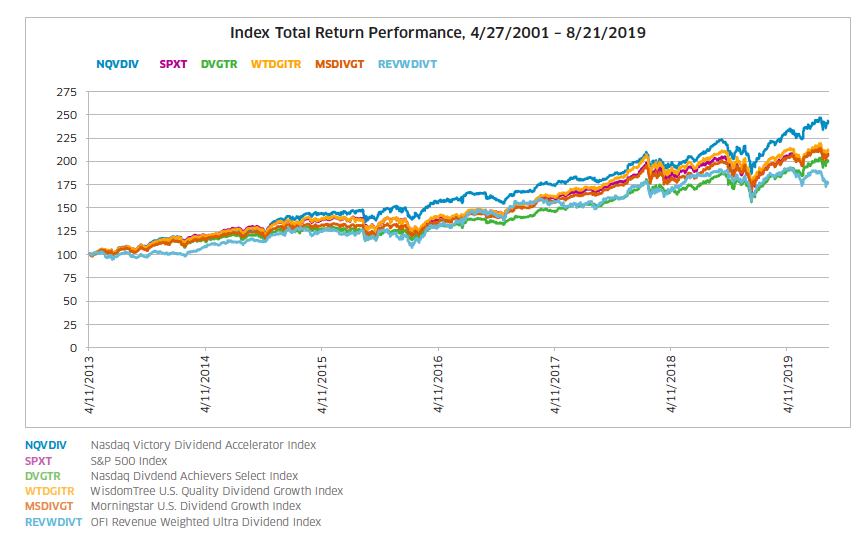
The result of NQVDIV’s multi-layered, dynamic approach to generating robust long-term dividend growth has demonstrated a sustained and compounding level of outperformance versus the wider market and dividend focused indexes alike.
The Nasdaq Victory Dividend Accelerator Index (NQVDIV) offers a transparent, rules-based approach that aims to capture the alpha-generating qualities of long-term exposure to a portfolio of disciplined, resilient dividend growing securities. The VictoryShares Dividend Accelerator ETF (VSDA) tracks the Nasdaq Victory Dividend Accelerator Net Total Return Index (NQVDIVN).
1. https://finance.yahoo.com/news/4-major-oil-producers-cut-190507857.html
2. http://www.bankrate.com/investing/what-to-do-when-companies-cut-dividends/
3. The universe excludes REITs and BDCs
Nasdaq® is a registered trademark of Nasdaq, Inc. The information contained above is provided for informational and educational purposes only, and nothing contained herein should be construed as investment advice, either on behalf of a particular security or an overall investment strategy. Neither Nasdaq, Inc. nor any of its affiliates makes any recommendation to buy or sell any security or any representation about the financial condition of any company.
Statements regarding Nasdaq-listed companies or Nasdaq proprietary indexes are not guarantees of future performance. Actual results may differ materially from those expressed or implied. Past performance is not indicative of future results. Investors should undertake their own due diligence and carefully evaluate companies before investing. ADVICE FROM A SECURITIES PROFESSIONAL IS STRONGLY ADVISED.
© Copyright 2019. All rights reserved. Nasdaq is a registered trademarks of Nasdaq, Inc.
