A more detailed look at this update can be found in the following video:
Yogi Berra is one of the most quoted sports figures of all time. Full of many quips, like “when you come to a fork in the road, take it” and “90% of the putts that are short, don’t go in”, Yogi certainly had a way with words.
Yogi was full of these many quips called “Yogi-isms.” Yogi-isms are fun expressions that lack logic. This week’s update will use a few Yogi-isms to describe the markets, which also lack logic.
- “You can observe a lot just by watching”
- “It’s like déjà vu all over again”
- “It ain’t over till it’s over.”
“You Can Observe a Lot Just By Watching”
Currently, the S&P 500 is divided into 11 sectors, or categories. Those sectors are listed below, along with each sector’s current weighting within the S&P 500. From the table below, you can see that Technology is by far the top weighted sector, making up around 27% of the S&P 500’s total market capitalization:
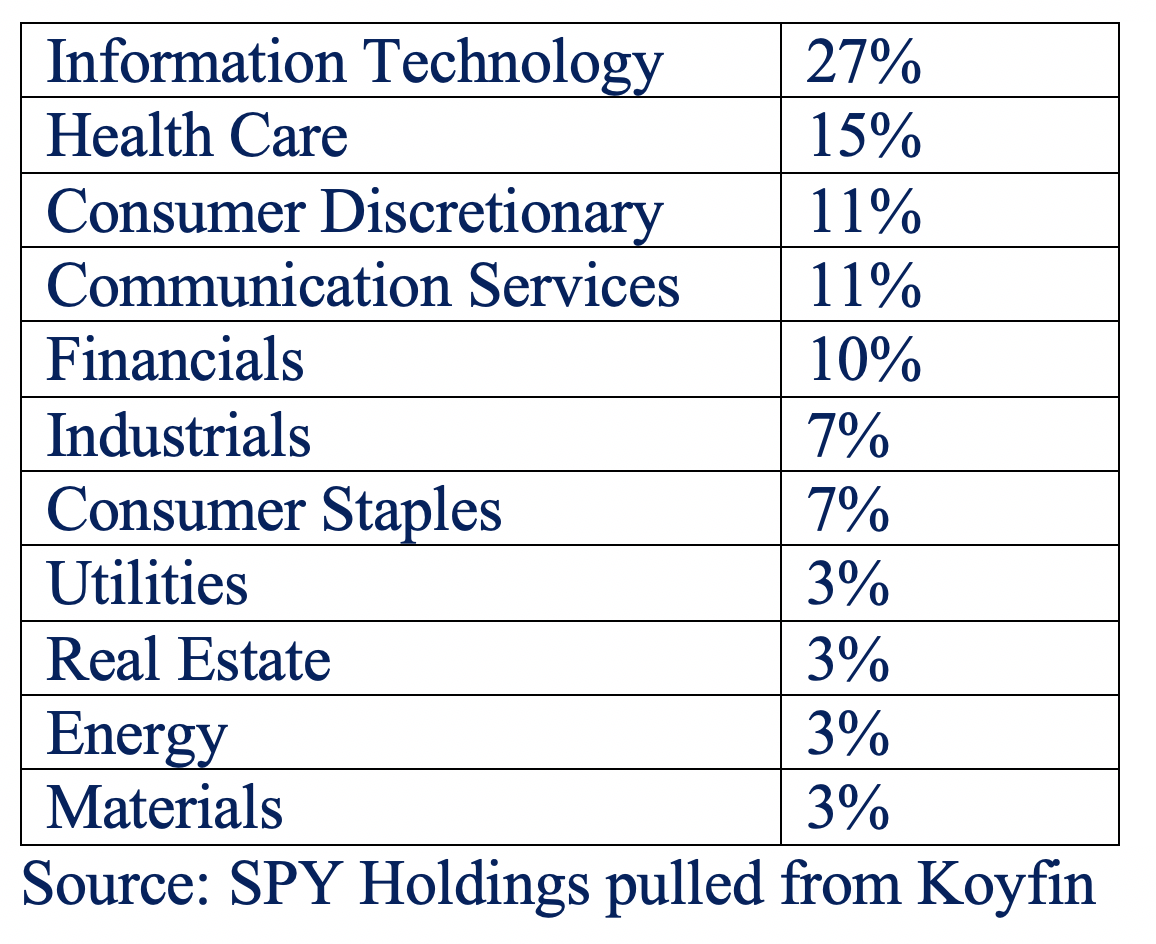
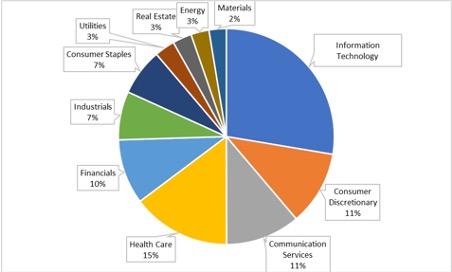
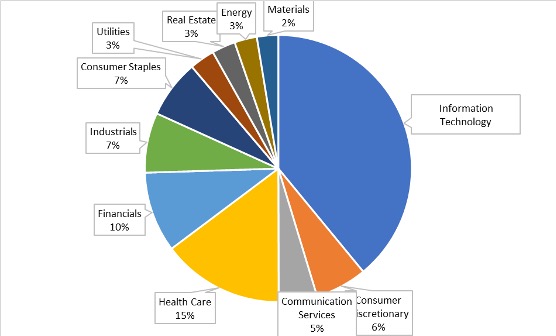
The Technology sector has a substantial impact on the S&P 500’s performance, due to its large weighting. In addition, a few years ago, several stocks were pulled from technology and inserted into the Communications sector. These stocks were Google, Facebook, and Netflix. Amazon, which is more correlated to technology, is actually listed as being in Consumer Discretionary (and makes up over 30% of the sector). If you include these stocks, which have historically been related closely to technology, as being technology, then the Technology sector would make up over 38% of the total S&P 500!
The chart below shows the weightings of the S&P 500 sectors. In this chart, Amazon was pulled out of Discretionary and added to technology (bringing Consumer Discretionary from 11% market cap to 6%) and Google, Facebook, and Netflix were also added to technology (bringing Communications from 11% to 5%).
Source: SPY Holdings pulled from Koyfin
You can observe a lot just by watching. There has been only ONE other time where technology stocks have made up this large of a contribution to the S&P 500… and that was the year 2000.
“It’s Like Déjà vu All Over Again…”
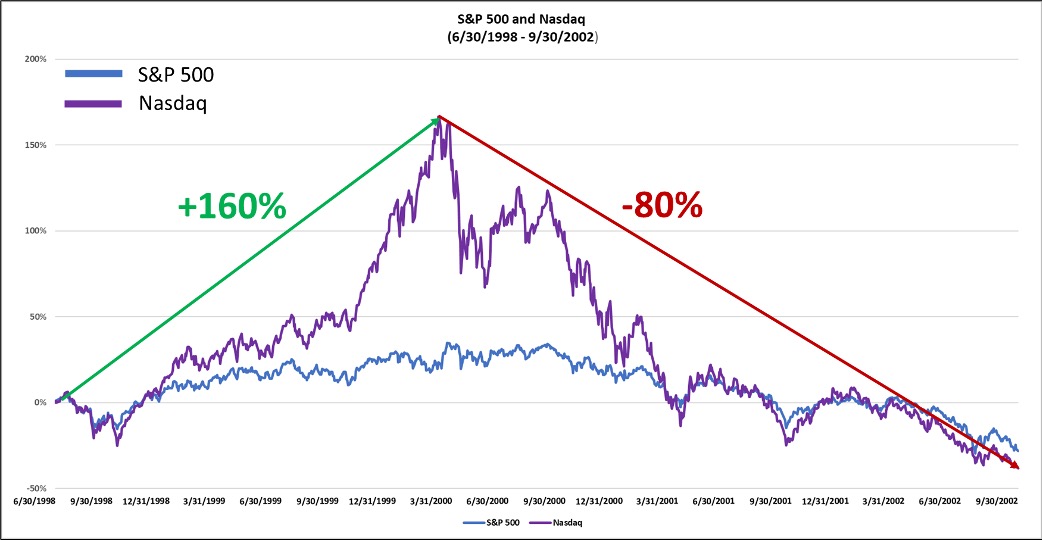
Back in 2000, the Technology sector (in conjunction with communications) accounted for nearly 35% of the S&P 500, as a result of roaring and gaining market share through most of the 1990s (back in 1990, Technology only accounted for 6% of the S&P 500). The sector was outpacing the rest of the market by a substantial margin. Then, the 2000 tech crash occurred. This was the case of a classic bubble, and all bubbles end the same way… with a pop and drop.
Source: CIM
That brings us to our current question: Is Technology now in a bubble again?
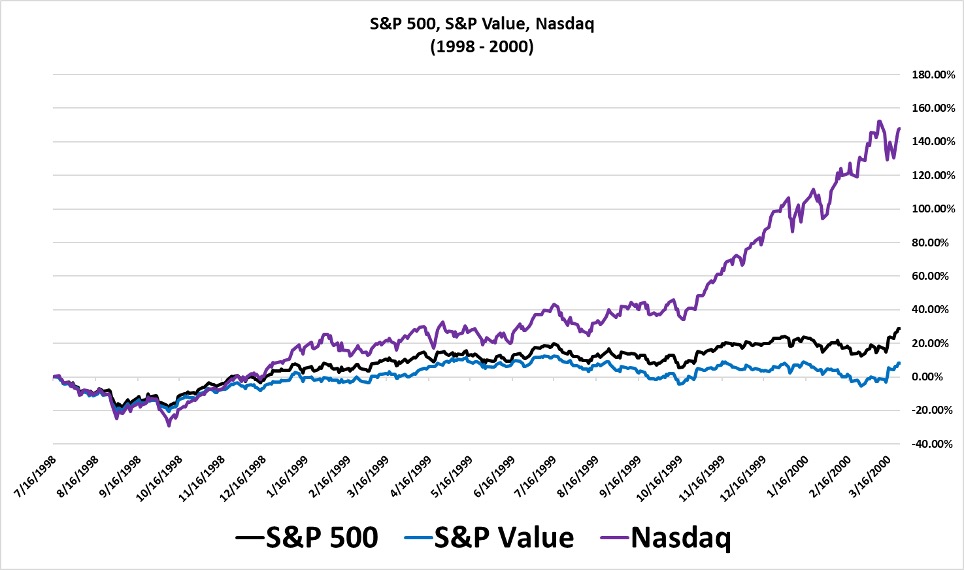
Heading into 2000, technology had substantially outpaced not only the S&P 500, but also value stocks. While the Nasdaq (which represents the largest technology companies) shot almost straight up, and carried the S&P 500 (thanks to its large technology sector weighting), Value struggled:
Source: AIQ
In the chart above, which shows the Nasdaq in Purple; the S&P 500 in black; and Value in blue, the Nasdaq substantially outperformed. You can see in the last third of the chart, while the Nasdaq doubled, Value stocks basically moved sideways. The S&P 500 rose modestly as it was carried by technology.
Fast forward to today: is this Déjà vu all over again?
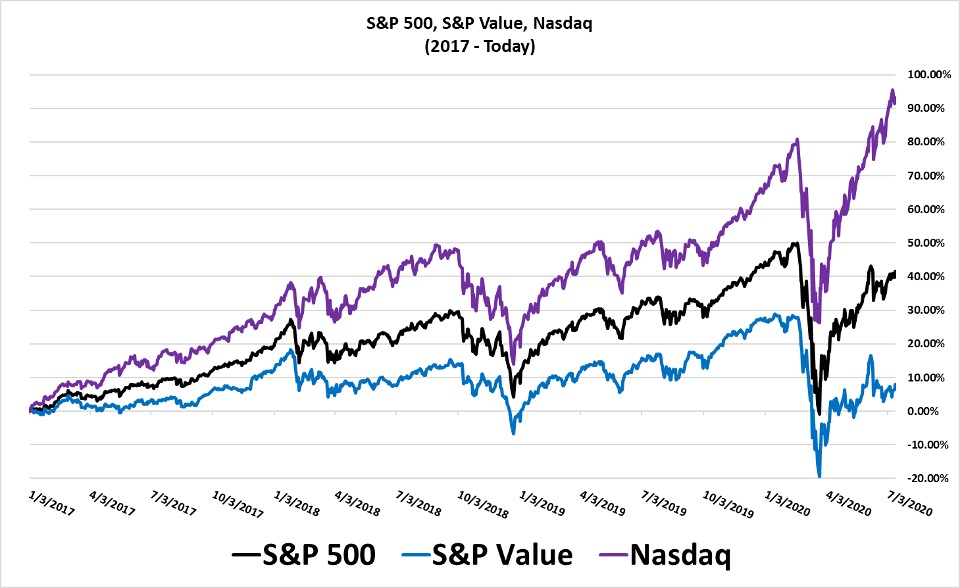
Since the start of 2017, the Nasdaq (Technology) has substantially outperformed both the S&P 500 and especially Value. This is similar to what was seen back in 2000. You can see heading into 2020, the Nasdaq rose sharply. During the market anomaly back in March, the Nasdaq dropped less, and rose more, creating a parabolic advance. Parabolic moves all eventually end the same way…
Meanwhile, Value has struggled throughout the entire timeframe. The S&P 500 is mostly being carried by Technology.
“It ain’t over till it’s over”
Investing is a lifetime endeavor. It can be easy to get caught up in the short-term. A movement full of emotion that would take years to play out, has occurred in under 6 months. Investors have rotated between two extremes in investing: a panic-driven drop and now a panic-driven rise.
Right now, technology is carrying the markets, while many other segments, like Value, struggle in comparison. Technology-related stocks make up over 35% of the market’s movement. The only other time when a sector has been that large was back in 2000, which we now know was a bubble. Amazon, Apple, and Microsoft (which make up 15% of the overall market) are all up 70%, 30%, and 40% year-to-date, while Value stocks are down -15%. Even an equal weight S&P 500, which gives the same weighting to each of the 500 stocks in the index, is down -10%.
The fact is that this is a different type of market environment than we have experienced in the last 10 years. The March decline was overexaggerated based on panic selling, and now the emotions of investors have shifted to the opposite extreme. Make no doubt it, this is a highly risky market environment, and it ain’t over till it’s over.
Make no mistake, this market is a loaded gun ready to fire. When it does fire, investors will not want to be benchmarking themselves versus the S&P 500—it’s not an efficient portfolio. The S&P 500’s weightings are out of control, with 38% invested in just one sector. From a portfolio management perspective, its weightings are way out of line.
Making Predictions is Tough, Particularly When Talking about the Future
When navigating this market environment, it is easy for days to feel like weeks, weeks to feel like months, and months to feel like years. The market is less than 6 months into this current environment. The emotions that were felt during March have changed dramatically. The fact that investors are experiencing these emotions further signals a volatile market. Making predictions is tough, particularly when talking about the future (another Yogi-ism). That is why we want our portfolio to remain stable.
Markets will move in both directions. When they do, there will be opportunities to benefit from those fluctuations. Until that happens, however, investment portfolios should be set up to take the risk off of the table, and have decreased volatility, regardless of the market’s movements.
The views and opinions expressed herein are the views and opinions of the author and do not necessarily reflect those of Nasdaq, Inc.
