
 Credit: Shutterstock photo
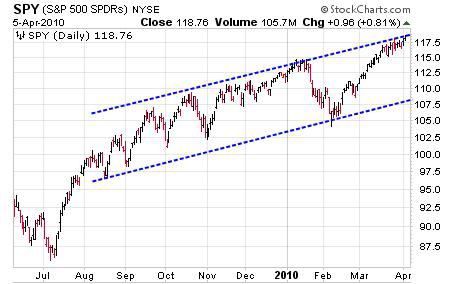
Our basic stock market message remains the same. The cyclical bull market is clearly intact, and deserves the benefit of the doubt until bearish evidence accumulates. Although some warning signs are emerging (e.g. rising bond yields, investor complacency), the stock market shows no signs of topping out. Technically, the stock market continues to look very healthy, although it is obviously overbought on a short term basis (Exhibit 1).
Exhibit 1
Stocks are enjoying a powerful trend and strong upside momentum. Since the first quarter correction ended on February 8th, the S&P 500 has moved relentlessly higher, climbing over 12% in eight weeks. Market breadth - the degree of participation in the rally - is surprisingly strong and resilient given how far stocks have come in the past year. We expect to see a deterioration of breadth prior to a peak in the major averages, but for now, the stock market is firing on all cylinders. Liquidity remains plentiful, thanks to extraordinary fiscal and monetary stimulus. The Fed's zero percent interest rate policy provides an almost irresistible incentive for investors to take on risk and reach for yield and returns. The maintenance of a zero percent interest rate policy, which translates to a negative real (inflation-adjusted) interest rate, is a financial market anomaly that has the potential to push the prices of risk assets much higher than fundamentals would seem to warrant. Government spending continues to expand at a breathtaking pace.
There is a growing realization that the country is on a course towards an eventual fiscal crisis, but the assumption is that the day of reckoning is a number of years in the future. In the meantime, the consensus view is that reflationary policymaking is working, first in the markets and now in the economy, and that the government and the Fed will continue to apply whatever stimulus is needed to sustain the recovery and the bull market. Valuations on broad U.S. stock indexes are no longer attractive in an absolute sense, only relative to zero percent interest rates and generally unappealing bond market yields.
At 19x long-term trend-line earnings, the S&P 500 is in the highest quartile of its historical valuation range, and is priced to deliver sub-par returns over a longer-term period (5 to 10 years). Given that the S&P 500 is trading at the upper boundary of a rising price channel that extends back to August (Exhibit 1), now is not the time to be adding to U.S. stock positions. It is likely we will get a correction or consolidation period over the next few weeks that would relieve the short-term overbought condition and provide a better entry point for a possible next leg higher.
Of course, no one knows the path any market will take, but we suspect the bullish momentum is within a few months of exhausting itself and that stocks will then have a sharp decline to new lows for the year (i.e. below the 1060 level on the S&P 500 seen in early February). Our view is that the recent improvement in economic statistics is largely stimulus-driven, and an economic relapse in the second half of the year remains a distinct possibility. Given that stocks are now pricing in a more robust recovery and an accelerating earnings cycle, there is growing room for disappointment from weaker than expected economic and earnings performance later in 2010.
In short, we are looking for an important stock market peak sometime in the second quarter, or perhaps the early part of the third quarter, which would be a time to move to a significantly more defensive investment posture.
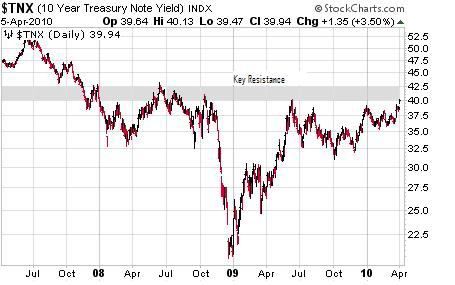
Benchmark Treasury Bond Yield Tests 4% Level
The 10-year yield recently broke out of its 2010 trading range between 3.6% and 3.8%, and is now testing the 4% level, which has not been exceeded since 2008. The 4% to 4.25% area represents a key resistance zone for the 10-year Treasury bonds (Exhibit 2). A move in yields above this resistance level would prove problematic for the U.S. recovery.
Exhibit 2
Our assessment is that we are in a grinding bear market in bonds that will persist over the next several years. The interest rate environment has been distorted by Fed policy of zero percent short term rates combined with quantitative easing (i.e. the direct purchase of bonds). Absolute yield levels in most areas of the bond market are now unattractive and need to move higher to provide an adequate margin of safety for inflation and credit risk. There will likely be periodic counter-trend rallies in Treasury bonds, brought about by economic growth scares and stock market downdrafts, but investors should operate under the assumption that the major trend in U.S. bond prices is down.
The anchor of zero percent short term interest rates and deflationary forces in the economy could conceivably keep the 10-year Treasury bond yields from breaking above 4.25% in 2010, but over the next several years, we see T-notes moving up towards 6% in response to the combination of rising inflation fears and the spreading realization of the U.S. government's fiscal crisis. It is not at all far-fetched to imagine a world of 6% T-Note yields; the average 10-year yield in the 1990s was 6.6%.
See also Monday Options Brief: GS, DGX, GDP & MRK on seekingalpha.com
The views and opinions expressed herein are the views and opinions of the author and do not necessarily reflect those of Nasdaq, Inc.
The views and opinions expressed herein are the views and opinions of the author and do not necessarily reflect those of Nasdaq, Inc.


