
Crude oil has been pushing up against a resistance zone for four days as defined by a relatively narrow price range. Again, on Tuesday, crude rallied to a new trend high of 82.24 before encountering resistance that took the price of crude down near the lows for the day. It continues to trade near the lows of the day at the time of this writing.
Small Expanding Triangle Consolidation Forms
During the four-day consolidation phase crude has formed a small expanding triangle pattern. It may designate a high and lead to a retracement or crude may break out of the pattern to the upside. Either way, it has reached the point that a decision needs to be made. Crude either breaks out to higher prices or it succumbs to selling pressure and retraces some degree of the recent advance. Of course, the third alternative is further consolidation and expansion of the triangle.
Reaches Key Resistance
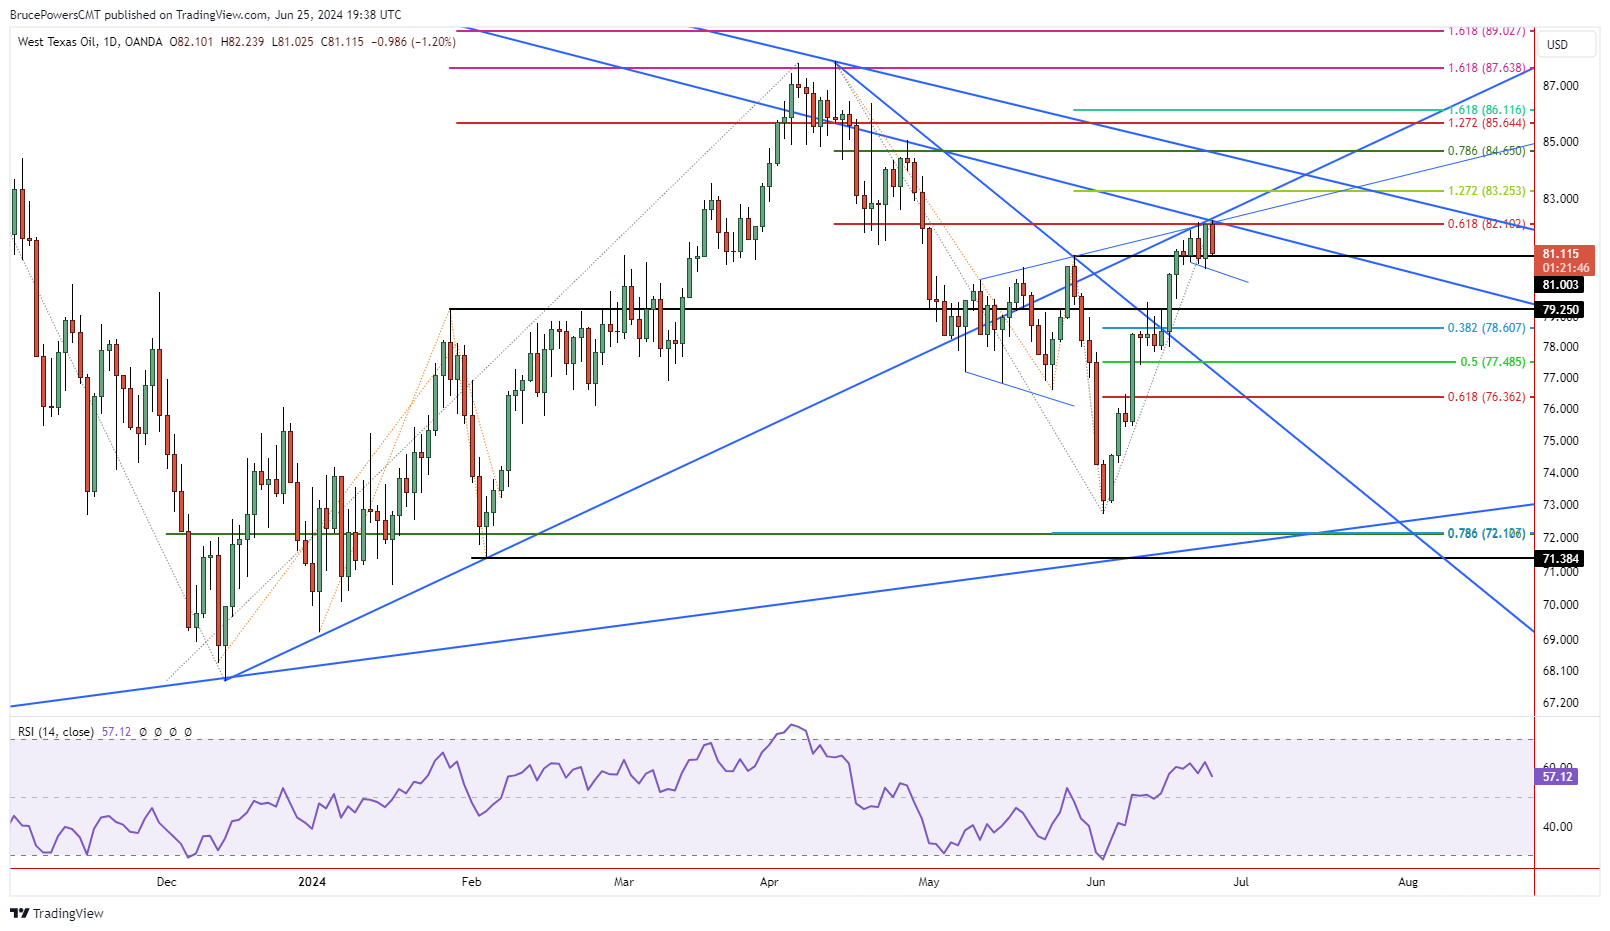
The fact that crude has been testing resistance for the past four days while it remains huddled near recent highs is a testament to its strength. Notice that resistance has been seen at the 61.8% Fibonacci retracement level and the convergence of the two trendlines. Also, a third line converges that rises from the top of an earlier expanding triangle consolidation pattern. Earlier, the top of the resistance zone was estimated at 82.26. That price level looks like it remains a valid level to key off. Therefore, a decisive breakout above 82.26 may signal a continuation of the rising trend. But it wouldn’t be surprising to first see a continuation of consolidation.
Tuesday’s High Completes 13.1% Rally
Crude was up as much as 13.1% at today’s high when measured from the June 4 swing low. It got there quickly, in only 15 days. Further consolidation near recent highs would sustain a bullish outlook as crude deserves a little rest before proceeding, if it is to do so. If a decisive breakdown from the expanding triangle triggers the 79.25 price area is the first target, followed by the 38.2% Fibonacci retracement at 78.61.
For a look at all of today’s economic events, check out our economic calendar.
This article was originally posted on FX Empire
More From FXEMPIRE:
- NASDAQ 100 Price Forecast – NASDAQ 100 Continues to Show Volatility
- Crude Oil Price Forecast – Crude Oil Continues to Bounce Around in a Range
- Nasdaq 100, Dow Jones, S&P 500 News: Modest Gains for Tech Stocks as FedEx and Whirlpool Surge
The views and opinions expressed herein are the views and opinions of the author and do not necessarily reflect those of Nasdaq, Inc.

