Building a Better Dividend Strategy with Nasdaq US Dividend Achievers
The Nasdaq US Dividend Achievers 50 IndexTM (DAYTM) is comprised of the top 50 securities by modified dividend yield from the Nasdaq US Broad Dividend Achievers IndexTM (DAATM), which is designed to track US securities with at least 10 consecutive years of increasing annual regular dividend payments. In addition to being high yielding, each security must have a strong liquidity profile (trailing three-month average daily trading volume of at least $1 million) and size (at least $1 billion in market cap). REITS and securities issued by limited partnerships are excluded from the index. Index securities are evaluated annually in March based on market data as of the end of December.
Before we dive into dividend indexes, their history and what makes them compelling in the current macroeconomic environment, it is worth looking at how companies have approached dividends during past downturns. During a recession, dividends are important as they give investors a cushion even when the stock price falls. Companies typically lay off workers, delay capital expenditures, and cut costs1. They are less likely, however, to cut dividends. According to a study done by Goldman Sachs, during the 12 recessions since World War II, the median decline in dividends paid by S&P 500 companies was a mere 1%, with no decline in five of 12 recessions-- 1949, 1974, 1980, 1981 and 1990. The recession that went from late 2007 through mid-2009 was an outlier in terms of dividend cuts, with S&P 500 dividends per share dropping by 24%. This was the worst result of any U.S. recession going back to the late 1940s, driven by a once-in-a- century financial crisis and a collapse in that industry’s usually substantial dividends. With the 2001 recession that was closely related to the bursting of the technology bubble, S&P 500 dividends fell by 6%, the second- worst behind the 2007-2009 downturn. If history provides any indication, companies are less likely to make drastic cuts to dividends in the event of a recession in 2023.
Well-constructed dividend indexes are likely to offer refuge during a recessionary environment given their inherent characteristics. During downturns, equity markets decline along with earnings and output. While stock prices can be volatile during downturns, dividends are less volatile. It would be fair to conclude that a dividend strategy can add diversification to a typical equity portfolio and downside protection in falling markets. While some of the more defensive high dividend stocks can lose their performance edge when economic conditions improve, the current macro environment suggests a strong possibility of interest rates remaining elevated for an extended period of time. This should enhance the relative positioning of high dividend paying stocks vs. those that pay little or no dividends.
Recent history provides further indication that dividend indexes offer protection against a tough environment. The standard 60/40 portfolio registered its second-worst year ever in 2022, as both stocks and bonds declined due to a hawkish Federal Reserve. In contrast, ETFs tracking Value and Dividend indexes recorded their best years ever in terms of net flows2. Dividend ETFs had a record $72 billion in inflows, 68% more than 2021’s record. The preference for value over growth, defensive over cyclical was largely due to the dynamics of the macroeconomic environment in 2022 with concerns around higher rates, slower growth and elevated inflation predominating. Investor sentiment is unlikely to change drastically in early 2023 as recession fears have only increased, despite some cooling in inflation and early indications of a slowing in Fed rate hikes.
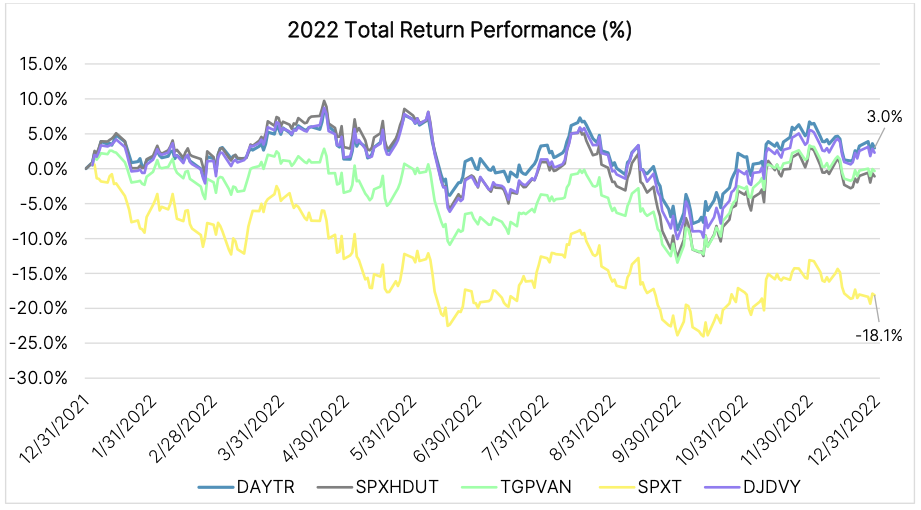
DAY’s Strong Performance in 2022 Demonstrates Defensive Nature of Index
2022 was a challenging year for the stock markets with most major equity indexes down significantly, including the S&P 500 which was down 19.4% and the Nasdaq-100®, down 33% on a price-return basis. Investor concerns surrounding rising interest rates, high inflation and slowing economic growth triggered major sell-offs punctuated by a few periods of relief rallies. Recession fears weighed on investors much of the year.
While concerns surrounding a recession in the first half of 2023 remain elevated, there are some encouraging signs from recent job market data that the U.S economy can avoid a recession with the Federal Reserve engineering a ‘soft landing’. Even in this contrarian case, dividend indexes can offer a degree of protection against uncertainty. As with 2022, there is much uncertainty in the geopolitical environment with the possibility of an escalation of the conflict in Europe that could put renewed pressure on energy prices. The return of demand from the average Chinese consumer after years of rolling lockdowns could exert incremental upward pressure on energy and other commodity prices, as well. In other words, there might very well be a return of elevated inflation and, as a result, elevated equity volatility. In such an environment, dividend indexes are likely to continue to offer relative safety in 2023, as they did in 2022.


Long-Run Performance and Volatility Review
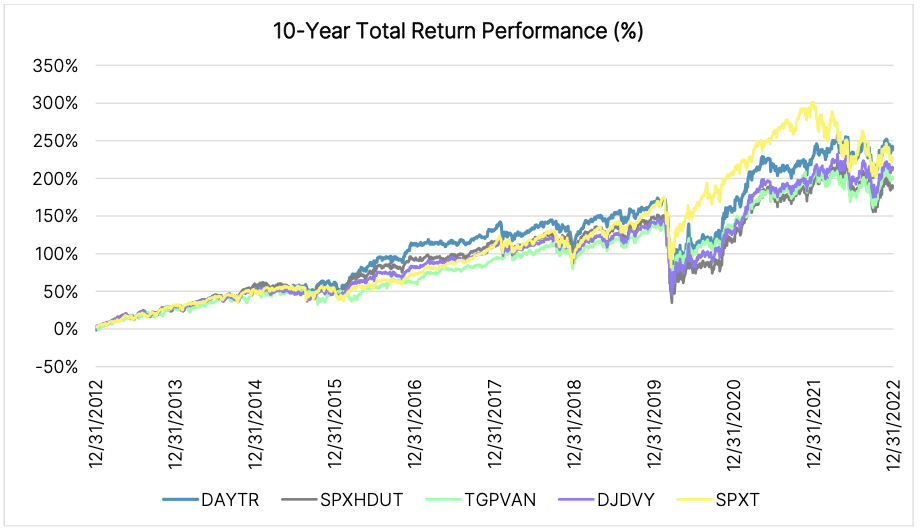
Since December 31, 2012, DAY has outperformed the S&P 500 in four out of 10 calendar years, while its parent index (DAA) has outperformed three times. Two observations about the timing of outperformance and underperformance are worth highlighting. For both indexes, 2020 was their worst year of underperformance as the unprecedented economic impacts of the Covid-19 pandemic prompted widespread dividend cuts in an effort to preserve cash. The downturn was almost as swift as its recovery, though, and there is little expectation of a repeat scenario of widespread cuts anytime in the foreseeable future. 2020 also fell in the middle of an extended streak of underperformance from 2017-2021, as interest rates reached historic lows and the spread between growth and value factor valuations reached all-time highs. This too seems unlikely to recur in the near future as rates have largely normalized. In contrast, 2022 marked a year of significant outperformance for both indexes as investors looked for relative safety in a volatile market, and placed a premium on high-yielding equities in the face of rising rates and a four-decade high in inflation.
Historically, when inflation has been high, stocks that have increased their dividends have outperformed the overall market. As per a study done by Fidelity, dividends produced 54% of the total return during periods when inflation averaged 5% or higher, vs. roughly 40% of the total return of the S&P 500 overall since 19303. Stock dividends often rise when inflation rises, which explains why DAA and DAY handily outperformed SPX last year. The key takeaway is that dividends are not only an important source of the stock market’s total returns, but become even more important during periods of elevated inflation and volatility. In terms of risk, DAA exhibited consistently lower volatility than SPX across all 10 calendar years, while DAY did so in only five; yet, DAY’S average annual volatility over the 10-year period was still lower than SPX by approximately 45 bps, despite being a much more concentrated portfolio of only 50 constituents.
Defensive Sector Tilt of DAY Likely to Augur Well in the Coming Year
The DAY Index is tilted heavily towards Utilities (23.8%), followed by Financials (21.7%) and Consumer Staples (17.7%). These three sectors have stable growth outlooks and are likely to continue their trend of raising dividends over consecutive years. Technology, which constitutes nearly 26% of the S&P 500, has a much lower representation in DAY and DAA. Much of the S&P 500’s outperformance that we observed over the period from 2017-2021 came from its tilt towards the Technology sector, which was at or near historical highs.
Given the concerns surrounding a recession in 2023, sectors with a more defensive tilt such as Utilities, Consumer Staples and Healthcare are likely to be viewed more favorably by investors. To the extent credit quality remains fairly robust, Financials are also likely to outperform as rates remain higher for longer.
Strong Current and Historical Dividend Profile
As highlighted earlier, one of the strengths of the DAY index is its dividend profile. Over the last five years, the index has generated annualized yields ranging mostly from 4-5%. This compares very favorably with DAA’s annualized yields ranging mostly from 2-3%, while SPX mostly stayed within a band between 1-2%. While other products look at companies with a long track record of dividend growth as a standalone or highest yielding securities as a standalone, DAY looks at both. Its improvement vs. DAA proves that a better yield is possible without sacrificing overall return potential. On the other hand, periods with sharp market declines (e.g. March 2020), show how yields can spike as a function of prices declining. This illustrates the danger of simply selecting index constituents based on a single point-in-time ranking of yields from highest to lowest without taking into account dividend growth and consistency.
Conclusion
The Nasdaq U.S. Dividend Achievers 50 Index can offer strong protection to investors in an environment of geopolitical risks, upward pressures on inflation and slowing growth. 2022 illustrated the ability of the index to outperform in an uncertain and volatile macroeconomic environment. By way of construction, it offers concentrated exposure to a basket of 50 high-quality U.S. securities with a history of consistently increasing dividends. With a strong return profile and high dividend yield, it offers many compelling advantages to investors looking for stable income in a slowing economy. While there are periods when the index might underperform other broad-based benchmarks, its ability to provide protection against market uncertainty cannot be understated judging by its strong track record and recent outperformance.
Sources: Nasdaq Global Indexes, FactSet, Bloomberg, Barron’s, State Street Global Advisors, Fidelity ETFs currently tracking DAY include the Invesco High Yield Equity Dividend Achievers ETF (Ticker: PEY).
1 https://www.barrons.com/articles/dividend-stocks-recession-51657285544
2 https://www.ssga.com/us/en/intermediary/etfs/insights/december-flash-flows-looking-through-a-glass-onion
3 https://www.fidelity.com/learning-center/trading-investing/inflation-and-dividend-stocks
Disclaimer:
Nasdaq® is a registered trademark of Nasdaq, Inc. The information contained above is provided for informational and educational purposes only, and nothing contained herein should be construed as investment advice, either on behalf of a particular security or an overall investment strategy. Neither Nasdaq, Inc. nor any of its affiliates makes any recommendation to buy or sell any security or any representation about the financial condition of any company. Statements regarding Nasdaq-listed companies or Nasdaq proprietary indexes are not guarantees of future performance. Actual results may differ materially from those expressed or implied. Past performance is not indicative of future results. Investors should undertake their own due diligence and carefully evaluate companies before investing. ADVICE FROM A SECURITIES PROFESSIONAL IS STRONGLY ADVISED.
© 2023. Nasdaq, Inc. All Rights Reserved.

Nasdaq-100 Index
With category-defining companies on the forefront of innovation, the Nasdaq-100 index defines today’s modern day industrials.