News & Insights

Mark Marex, CFA, Senior Director, Nasdaq Index Research & Development
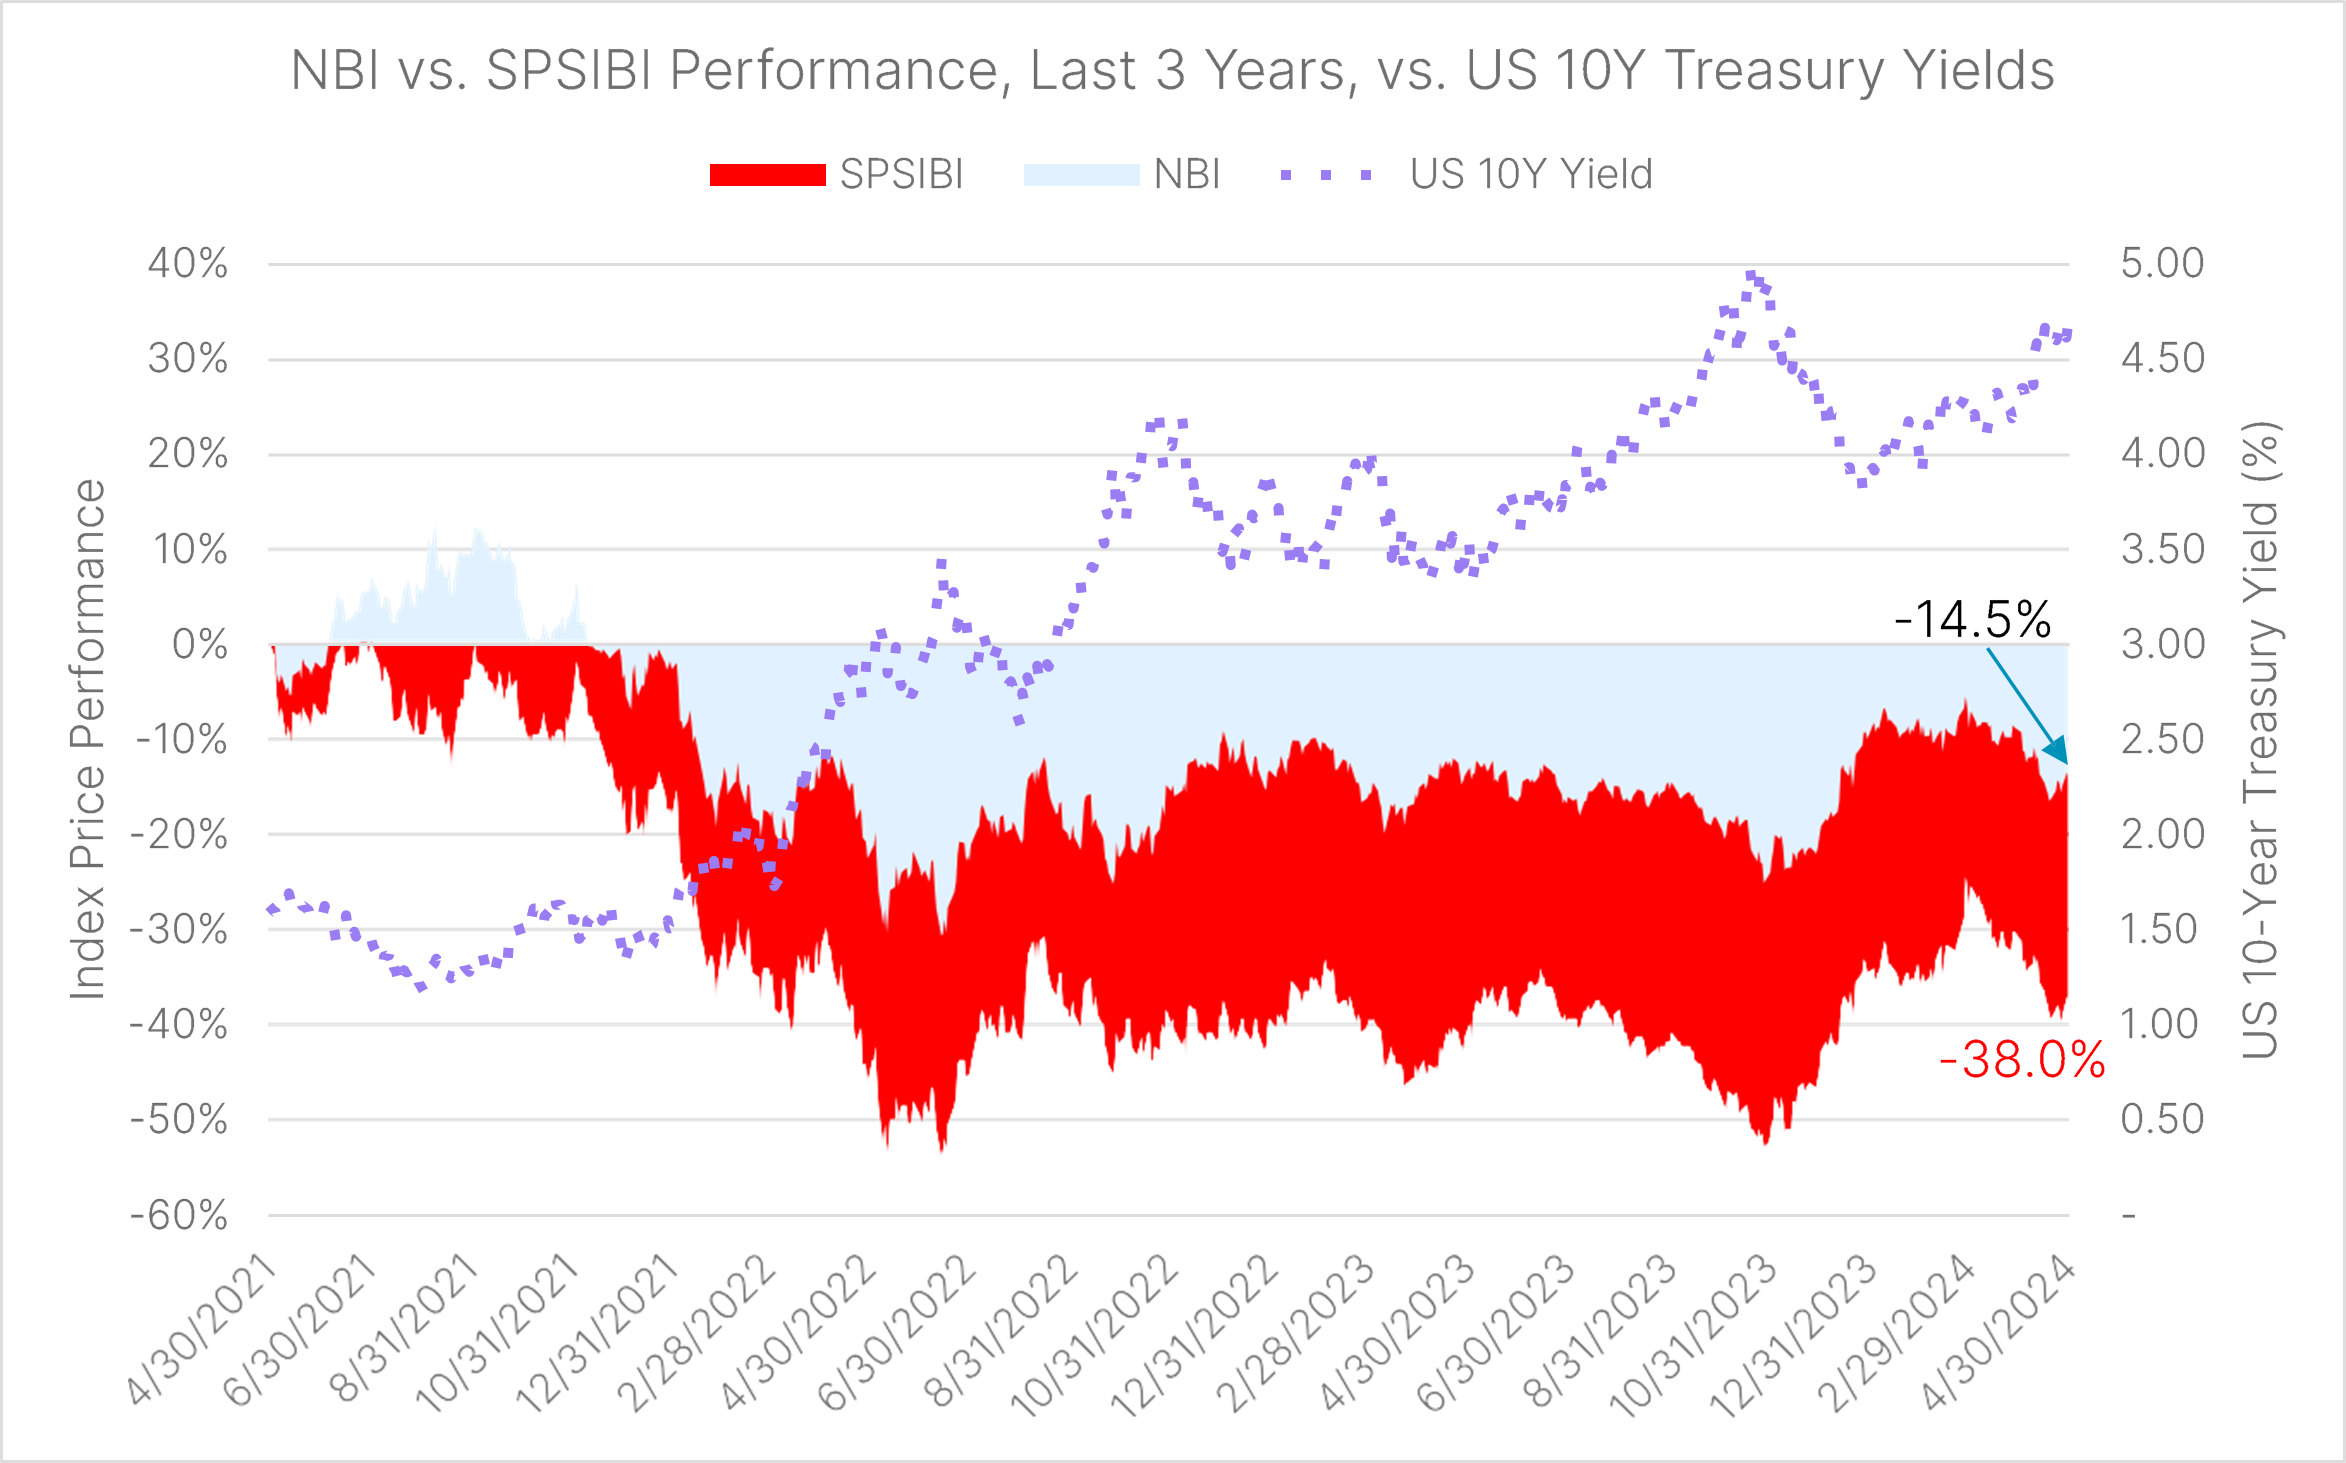
The Nasdaq Biotechnology™ Index (NBI®) has been the leading benchmark for the biotech industry since its launch in 1993, reflecting Nasdaq’s historical dominance in attracting biotech IPOs with an overall win rate of 98% in the US. In our previous research published in early 2022, we warned biotech investors that the historic surge in inflation, along with the accompanying interest rate hiking cycle, had the potential to suppress biotech IPO volumes and keep small-cap biotech valuations compressed indefinitely. We drew a distinction between the type of exposure that biotech investors receive via a leading competitor benchmark, the S&P Biotechnology Select Industry Index (SPSIBI), and NBI. SPSIBI utilizes modified equal weighting to construct a portfolio of stocks that dramatically overweights the small cap segment of the industry relative to the bigger, more established players that have maintained large cap status for much of the 21st century. While this approach may have been appropriate when the biotech industry was still in its infancy stage without any clear winners, it is no longer appropriate today given the enduring successes of companies such as Amgen, Gilead Sciences, and Regeneron Pharmaceuticals. Investors benchmarked to SPSIBI have suffered substantial losses of approximately 38% over the past three years, vs. only 14.5% for NBI. With interest rates remaining at historic highs, it is incumbent upon investors benchmarked to SPSIBI to reevaluate the wisdom of maintaining their exposure to the biotech industry with an approach that overweights the smallest, lower-quality companies that have been driving its recent underperformance.

Small Cap Quality is More of an Issue in Biotech
In a recent FT article, the overall extended underperformance of US small cap stocks vs. large caps was analyzed in a few different ways, using the Russell 2000 and Russell 1000 Indexes as the relevant, respective benchmarks. The authors noted that there has been a “severe deterioration” in the earnings quality within the Russell 2000 in the 21st century, with nearly a third of Russell 2000 companies now unprofitable vs. only 5% two decades ago. They note that the explosion in small cap biotech companies has meaningfully driven this change, with healthcare companies going from about 5% of the index weight – when “most of them were stolid, reliable companies” – to today making up “almost 16 per cent of the index, and most are high-risk, unprofitable biotech stocks.”[1] No such similar deterioration in quality is observable among US large caps. There are potentially multiple other factors in play, such as the inexorable rise in private equity’s assets under management funding more takeovers of small cap public equities – and presumably, the higher quality ones getting taken private more than those of lower quality – leading to an overall decrease in the quality of publicly-listed small cap companies left in the US equity market.
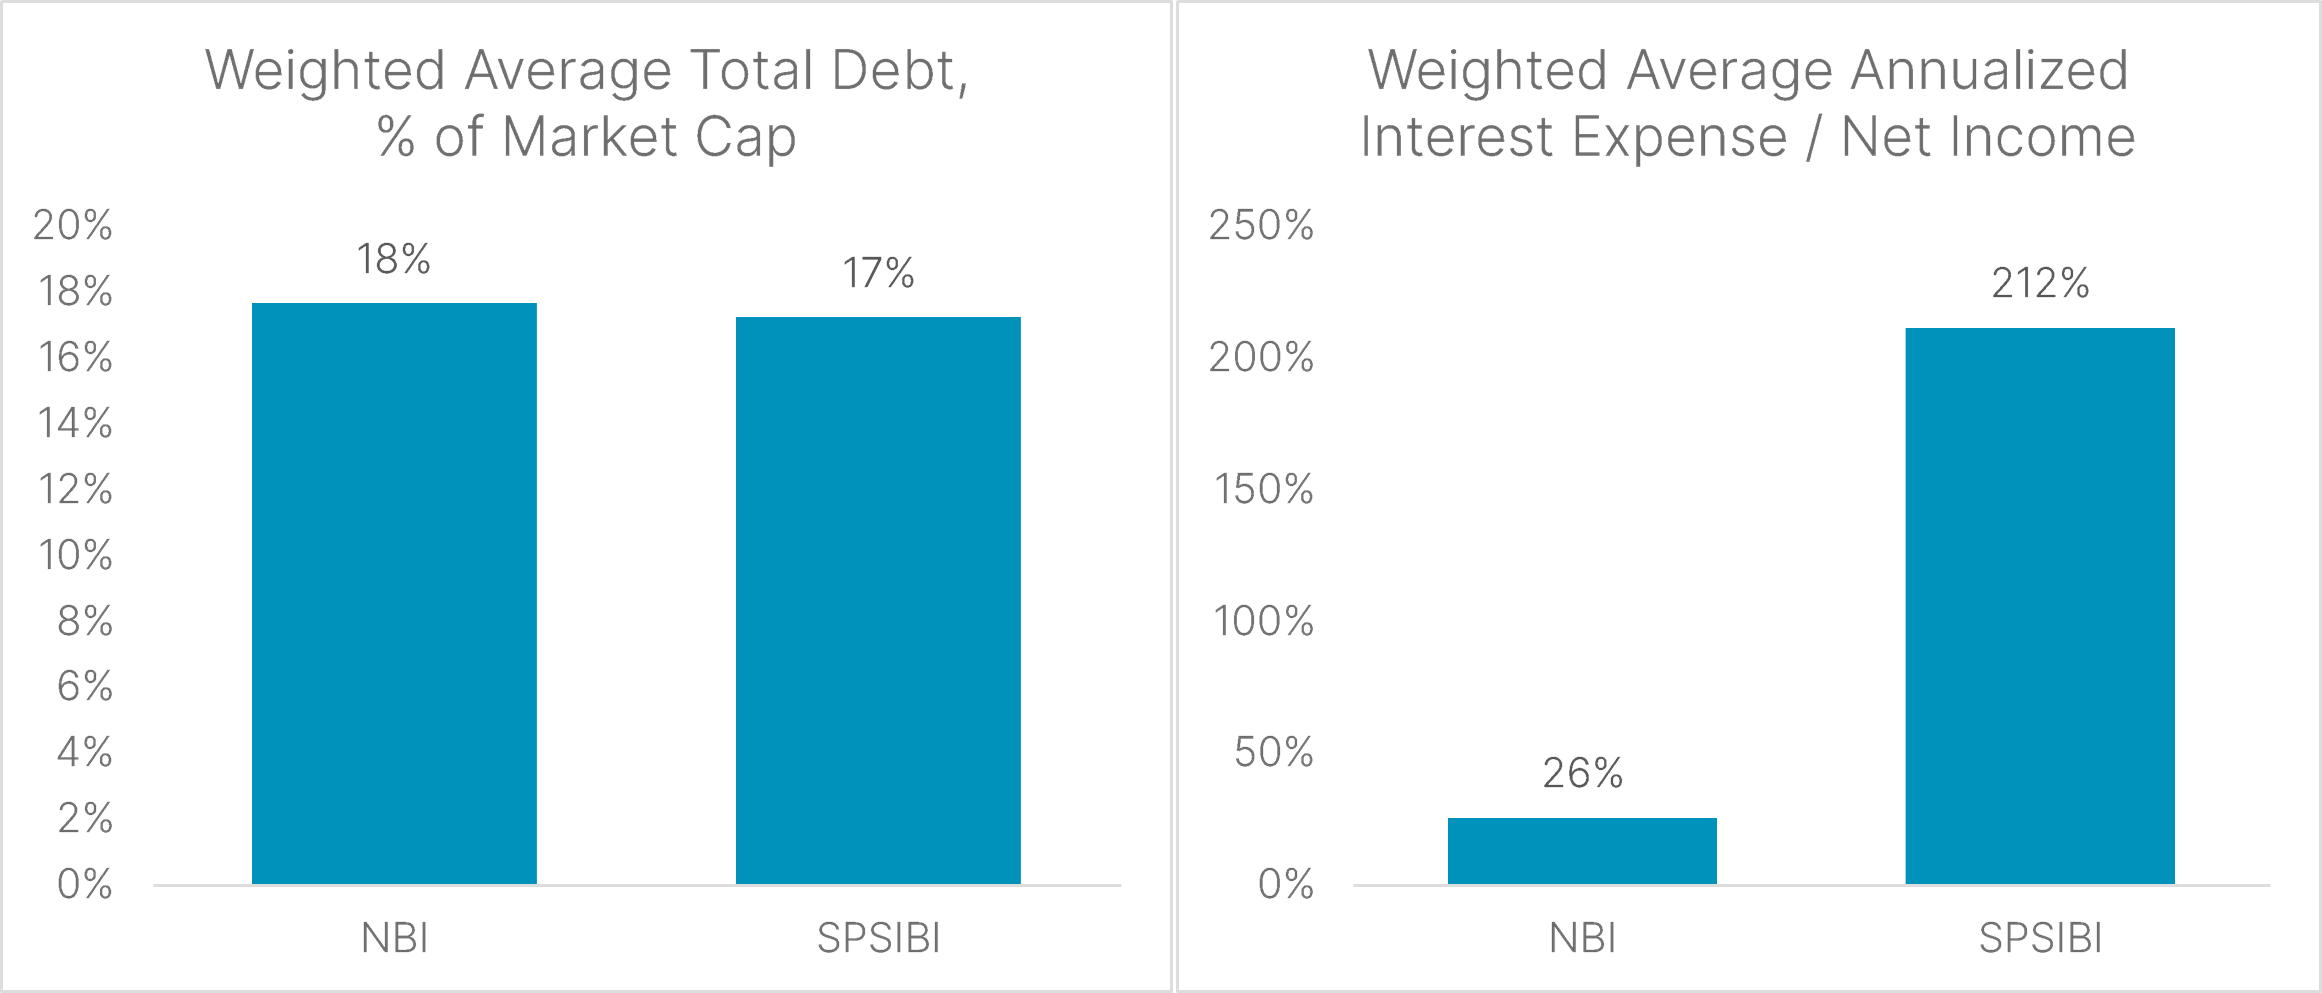
The underlying reality, though, is that today’s small cap companies tend to be less profitable, and more leveraged, than large caps – full stop. That is particularly important for biotech investors to rationalize when deciding on which benchmark to adopt in guiding their exposure to the industry. When comparing the ratios of total debt as a percentage of market cap, NBI and SPSIBI appear to be in-line. But after factoring in the starkly different profitability profiles across the two indexes, a very different picture emerges. On an index-weighted basis, SPSIBI generated net income of $41MM in the most recent 12-month period compared to $87MM of interest expense. In other words, the ratio of interest expense to net income stands at 212%. NBI’s ratio is only 26%, on the other hand, with a weighted average net income of $1.75B and $450MM of interest expense. This is largely driven by the relatively healthy leverage profiles of NBI’s largest constituents. The top 10 names, which accounted for 51% of the index weight as of April 30, 2024, generated net income of $20.9B vs. interest expense of $5.7B in the most recent 12-month period – equivalent to a ratio of 27%. The rest of NBI’s 208 constituents collectively generated a net loss of -$23.6B and interest expense of $5.2B.

Source: Factset, data as of April 30, 2024. All metrics are shown on an index weighted-average basis.
Biotech has long been recognized as one of the most speculative industries to invest in, precisely because most of its early-stage companies rely on securing funding for research and development (R&D) expenses prior to generating revenue, let alone a profit. Clinical trials take significant time and FDA approvals are never guaranteed. Why would investors choose to overweight the most speculative corners of the industry when picking a passive benchmark to guide their exposure?
Small Cap Biotech Margins Worsening vs. Large Cap
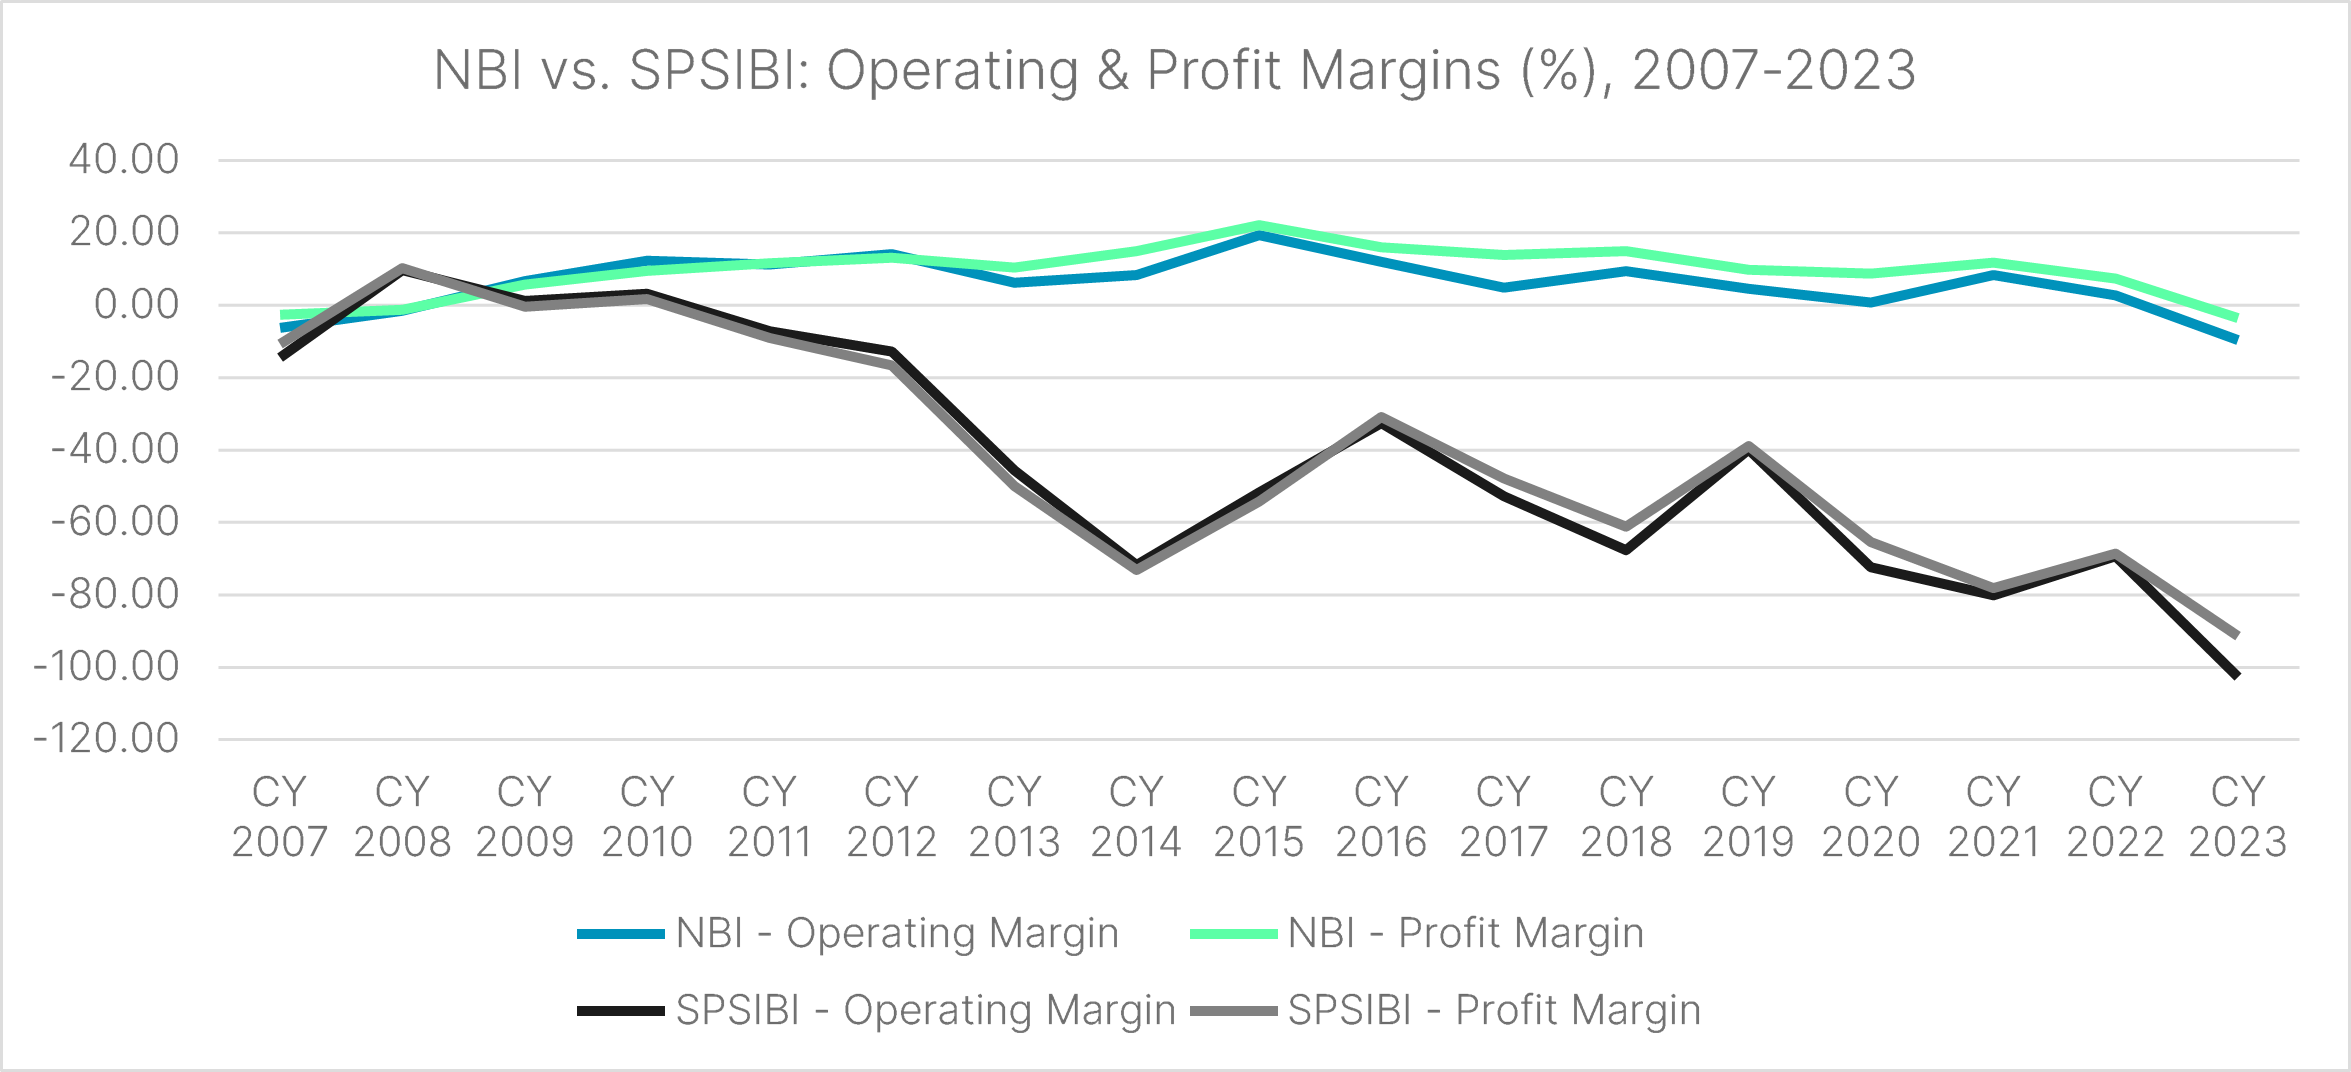
Beginning in 2010, operating and net (profit) margins for the S&P Biotechnology Select Industry Index (SPSIBI) have steadily worsened, reaching around negative 100% in 2023. For the Nasdaq Biotech Index (NBI), margins have been more stable and generally positive, although also succumbed to overall negative territory in 2023, dragged down by the deterioration across its smallest constituents. It should therefore come as no surprise that a substantial performance gap has opened up between the two indexes.

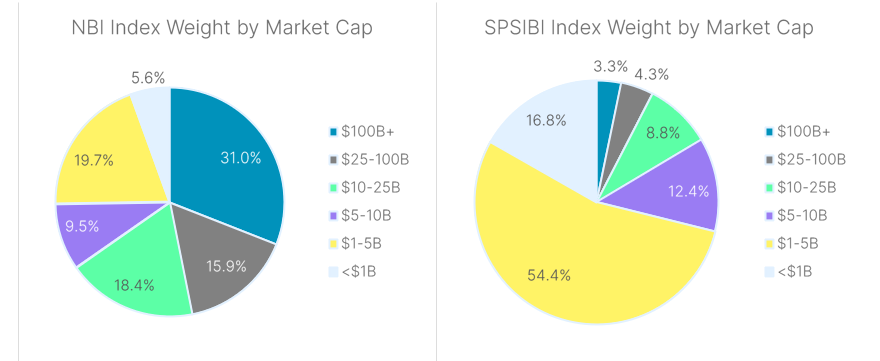
It is particularly noteworthy that this relative deterioration in margins had been ongoing for the better part of a decade prior to the recent spike in interest rates. The implication is that smaller biotech companies have become increasingly riskier to invest in, and an indexed approach that overweights the smallest names while underweighting the largest is no longer appropriate. By utilizing a benchmark like SPSIBI, biotech investors are taking unnecessary levels of risk for an unclear payoff, allocating nearly three-fourths of their exposure to companies with market caps under $5 billion. NBI is a mirror image, with only one-fourth of its exposure allocated to companies under $5 billion in market cap. On the flip side, NBI allocates nearly half of its exposure to true large cap biotech champions with market caps in excess of $25 billion, while SPSIBI allocates only 7.6% of its exposure to the same types of biotech companies.

Summary: Whither the Small Cap Premium?
The biotech industry has undoubtedly faced some challenges following the initial wave of optimism that took place during the Covid-19 pandemic. Among these challenges has been a steep rise in the level of interest rates in the US to counteract historically high inflation. Rising rates typically depress investor risk sentiment, especially in segments of the market that are highly speculative and/or sensitive to the cost of financing. Small-cap biotech companies have proven particularly vulnerable and have driven much of the recent poor performance in the Nasdaq Biotech Index (NBI). Thanks to its modified market cap weighting scheme, NBI has experienced muted drawdowns compared to its modified equal-weighted competitor benchmark, the S&P Biotechnology Select Industry Index (SPSIBI). NBI’s top 10 largest constituents contributed a net positive 10.5% to the index’s total return over the past three years, vs. a negative 22.9% return contribution from the rest of its (mostly small and midcap) constituents. For SPSIBI, these same constituents contributed only a net positive 2.2% due to their much lower weightings (ex-Illumina, ex-AstraZeneca which did not qualify for inclusion into SPSIBI at all).
Exhibit A: NBI’s Top 10 Constituents by Average Index Weight, Last 3 Years, Weightings/Returns/Contribution
| NBI Top 10 Company Name | Market | Total Return (%) 4/30/21 -4/30/24 | Average Index Weight (%) SPSIBI | Average Index Weight (%) NBI | Contribution to Return SPSIBI (%) | Contribution to Return NBI (%) |
|---|---|---|---|---|---|---|
| AMGEN INC | 164.4 | 24.9 | 1.0 | 8.4 | 0.3 | 2.4 |
| GILEAD SCIENCES | 82.4 | 16.2 | 1.0 | 7.8 | 0.2 | 1.4 |
| REGENERON PHARMACEUTICALS | 106.3 | 85.1 | 1.0 | 7.0 | 0.5 | 3.6 |
| VERTEX PHARMACEUTICALS | 116.3 | 80.0 | 1.0 | 6.9 | 0.6 | 4.1 |
| MODERNA INC | 62.9 | (38.3) | 1.0 | 5.7 | (0.0) | 0.1 |
| BIOGEN INC | 31.7 | (19.6) | 1.0 | 3.6 | 0.0 | (0.6) |
| ILLUMINA INC | 16.9 | (68.7) | N/A | 3.6 | - | (3.5) |
| ASTRAZENECA PLC-SPONS ADR | 244.4 | 53.1 | N/A | 3.4 | - | 1.4 |
| SEAGEN INC | N/A - Acquired | 59.1 | 0.9 | 2.5 | 0.6 | 1.6 |
| ALNYLAM PHARMACEUTICALS | 18.9 | 2.4 | 1.0 | 2.1 | 0.1 | (0.0) |
| Average / Total | $93.8B Average | 19.4% Average | 7.9% | 51.0% | 2.2% | 10.5% |
Some investors may be wondering about the tactical vs. long-term implications of changing their approach to tracking biotech to be more in favor of large caps and away from small caps. None other than Cliff Asness, founder of famed quantitative research shop AQR Capital Management, recently debunked the myth of a size premium among small cap companies. In summarizing his team’s findings, Asness stated that “small stocks beat large stocks historically but that’s only before adjusting for market beta,” and that ultimately, “there is nothing even resembling a long-term simple small firm effect. […] Adding in lags to account for illiquidity takes the historically weak small firm effect and renders it non-existent.” He goes on to note that “a different size effect, the size effect net of the quality factor, is quite strong (though we acknowledge this finding is not obviously implementable.”[1] That should resonate especially with biotech investors, who face an unusually low-quality universe of small cap companies to select from within the industry. Without a built-in quality screen, small-cap biotech investing could very well be a recipe for long-term underperformance.
As the leading benchmark for the biotech industry since 1993, every investor should recognize the compelling benefits of NBI’s market cap-weighted approach to index construction, especially in a time of elevated interest rates and heightened economic sensitivity for the most speculative corners of the equity markets.
ETFs currently tracking NBI include the Invesco Nasdaq Biotechnology ETF™ (Nasdaq: IBBQ), ProShares Ultra Nasdaq Biotechnology ETF™ (Nasdaq: BIB), ProShares UltraShort Nasdaq Biotechnology ETF™ (Nasdaq: BIS), Invesco Nasdaq Biotech UCITS ETF™ (London: SBIO), iShares Nasdaq US Biotechnology UCITS ETF™ (London: BTEC), Capital Nasdaq Biotechnology Index ETF™ (Taiwan: 00678), and Mirae Asset TIGER Nasdaq BIO ETF™ (Korea: 203780).
ETFs currently tracking SPSIBI include the SPDR S&P Biotech ETF (NYSE: XBI).
Sources: Nasdaq Global Indexes, FactSet, Bloomberg, Financial Times, AQR Capital Management.
[1] https://www.ft.com/content/abfbf19e-f963-4c1b-b69e-7bef8896e8cd
[2] https://www.aqr.com/Insights/Perspectives/There-is-No-Size-Effect-Daily-Edition
Disclaimer:
Nasdaq® is a registered trademark of Nasdaq, Inc. The information contained above is provided for informational and educational purposes only, and nothing contained herein should be construed as investment advice, either on behalf of a particular security or an overall investment strategy. Neither Nasdaq, Inc. nor any of its affiliates makes any recommendation to buy or sell any security or any representation about the financial condition of any company. Statements regarding Nasdaq-listed companies or Nasdaq proprietary indexes are not guarantees of future performance. Actual results may differ materially from those expressed or implied. Past performance is not indicative of future results. Investors should undertake their own due diligence and carefully evaluate companies before investing. ADVICE FROM A SECURITIES PROFESSIONAL IS STRONGLY ADVISED.
© 2024. Nasdaq, Inc. All Rights Reserved.
Latest articles

This data feed is not available at this time.