
Amcor Plc AMCR reported second-quarter fiscal 2024 (ended Dec. 31, 2024) adjusted earnings per share (EPS) of 16 cents, which met the Zacks Consensus Estimate. The company reported earnings of around 16 cents per share in the year-ago quarter. Gains from improved volumes, continued strong cost performance and benefits from restructuring initiatives were offset by unfavorable impacts from price/mix.
Find the latest EPS estimates and surprises on Zacks Earnings Calendar.
Including special items, the company reported net earnings per share of 11 cents compared with nine cents in the prior-year quarter.
Amcor’s revenues dipped 0.3% year over year to $3.24 billion. The downside was due to a 1% unfavorable impact of foreign exchange and a 1% impact of pass-through of lower raw material costs. The volume rose 2.3% from the year-ago quarter. Price/mix had an unfavorable impact of approximately 2%, primarily due to lower volumes in high-value healthcare categories. The top line missed the Zacks Consensus Estimate of $3.44 billion.
Amcor PLC Price, Consensus and EPS Surprise

Amcor PLC price-consensus-eps-surprise-chart | Amcor PLC Quote
Amcor’s Cost & Margins in Q2
The cost of sales was down 0.6% year over year to $2.62 billion. Gross profit grew 0.8% year over year to $626 million. The gross margin was 19.3% compared with the year-ago quarter’s 19.1%.
Selling, General & Administrative expenses were $295 million, down 1.3% year over year. The company reported an operating income of $297 million in the fiscal second quarter compared with $242 million in the year-ago quarter.
Adjusted operating income was $363 million, up 3% from $352 million in the prior-year quarter. Improved volumes, continued strong cost performance and benefits from restructuring initiatives were offset by unfavorable impacts from price/mix. The adjusted operating margin was 11.2% compared with 10.8% in the prior-year quarter.
Adjusted EBITDA was $453 million compared with $454 million in the prior-year quarter.
AMCR’s Segment Performance in Q2
Flexibles: Net sales rose 1.2% year over year to $2.51 billion. Volume rose 3% year over year. However, unfavorable movements in foreign exchange rates and impacts related to the pass-through of higher raw material costs each had an offsetting impact on net sales of approximately 1%.
Our model projected net sales of $2.59 billion and 5.3% year-over-year volume growth. Adjusted operating income improved 3% year over year to $322 million. We expected an adjusted operating income of $332 million.
Rigid Packaging: The segment reported net sales of $730 million, down 5% from the prior-year quarter. Volume was down 1% year over year. An unfavorable 2% currency impact and an unfavorable impact of approximately 2% related to the pass-through of lower raw material costs also led to the decline in sales.
We expected net sales of $804 million and a volume increase of 3.6% from the prior-year quarter. Adjusted operating income was $53 million, 4% higher than the year-ago quarter. Our prediction for the segment’s operating income was $61 million.
Amcor’s Q2 Cash Flow & Balance Sheet Updates
At the end of the fiscal second quarter, Amcor had $445 million of cash and cash equivalents compared with $588 million as of fiscal 2024-end. The company generated $159 million of cash in operating activities in the first half of fiscal 2025 compared with $228 million in the year-ago comparable period.
As of Dec. 31, 2024, Amcor’s net debt totaled $6.5 billion, up from $6.11 billion as of June 30, 2024.
Amcor’s board of directors declared a quarterly cash dividend of 12.75 cents per share, to be paid on March 18, to shareholders of record on Feb. 26, 2025.
AMCR’s FY25 Guidance
Adjusted EPS is expected to be in the band of 72-76 cents. The company projects an adjusted free cash flow of $900-$1,000 million.
Amcor to Accelerate Growth With Berry Global Deal
In November 2024, Amcor announced that it had entered into a definitive merger agreement with Berry Global Group, Inc. BERY. This deal will boost AMCR’s growth strategy by focusing its portfolio on faster-growing, better-margin categories.
The deal will bring together two highly complementary businesses, combining Amcor's global flexibles and regional containers businesses with Berry Global's regional flexibles and global containers and closures businesses. It will create a global leader in consumer packaging solutions with remarkable innovation capabilities and scale.
Amcor stated that it expects to close the deal in mid-2025. The company currently estimates $650 million in benefits from identified costs, growth and financial synergies by the end of the third year of closing.
Amcor’s Price Performance
In the past year, AMCR shares have gained 3.7% compared with the industry’s 11.3% growth.
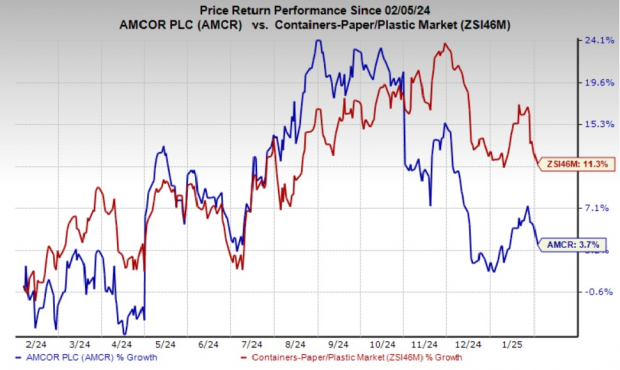
Image Source: Zacks Investment Research
AMCR’s Zacks Rank
Amcor currently carries a Zacks Rank #4 (Sell).
Performances of Other Packaging Stocks
Packaging Corporation of America PKG reported adjusted EPS of $2.47 in the fourth quarter of 2024, which missed the Zacks Consensus Estimate of $2.51 by a margin of 2%. The bottom line matched PKG’s guidance and grew 16% year over year. The upside was driven by higher prices and mix, improved volume in both segments, and lower freight and logistics expenses. However, these gains were somewhat offset by an increase in operating costs, scheduled maintenance outage expenses, depreciation expenses and other expenses.
Sales in the fourth quarter rose 10.7% year over year to $2.15 billion due to higher volumes and price/mix in both segments. The top line beat the Zacks Consensus Estimate of $2.13 billion.
PKG currently carries a Zacks Rank #3 (Hold).
Graphic Packaging Holding Company GPK posted an adjusted EPS of 59 cents in the fourth quarter of 2024, which missed the Zacks Consensus Estimate of 63 cents. The bottom line marked a 21% decline from the year-ago quarter. Sales in the fourth quarter were down 7% year over year to $2.1 billion. The top line fell short of the Zacks Consensus Estimate of $2.18 billion.
The decline in GPK’s sales was attributed to a $103 million negative impact from the divestiture of the Augusta, GA bleached paperboard manufacturing facility and bleached paperboard price and volume declines. The company also witnessed a $22 million net decline in sales from packaging operations, where price declines were partially offset by volume growth. Other acquisitions and divestitures (excluding Augusta) had a $14 million unfavorable impact on sales in the quarter, while foreign exchange had a $15 million unfavorable impact.
GPK currently carries a Zacks Rank #2 (Buy). You can see the complete list of today’s Zacks #1 Rank (Strong Buy) stocks here.
Zacks' Research Chief Names "Stock Most Likely to Double"
Our team of experts has just released the 5 stocks with the greatest probability of gaining +100% or more in the coming months. Of those 5, Director of Research Sheraz Mian highlights the one stock set to climb highest.
This top pick is among the most innovative financial firms. With a fast-growing customer base (already 50+ million) and a diverse set of cutting edge solutions, this stock is poised for big gains. Of course, all our elite picks aren’t winners but this one could far surpass earlier Zacks’ Stocks Set to Double like Nano-X Imaging which shot up +129.6% in little more than 9 months.
Free: See Our Top Stock And 4 Runners UpPackaging Corporation of America (PKG) : Free Stock Analysis Report
Graphic Packaging Holding Company (GPK) : Free Stock Analysis Report
Berry Global Group, Inc. (BERY) : Free Stock Analysis Report
Amcor PLC (AMCR) : Free Stock Analysis Report
To read this article on Zacks.com click here.
The views and opinions expressed herein are the views and opinions of the author and do not necessarily reflect those of Nasdaq, Inc.

