Abstract
Companies that have introduced the world to the digital age are widely owned by institutions. In this paper, we look at how options on the Nasdaq-100 offer efficient solutions for managing risk associated with a portfolio focusing on these stocks. In addition, we look at the unique behavior of NDX options and the opportunity to create superior structured outcomes.
Introduction
The S&P 500 is considered the benchmark for stock market performance in the U.S. while the Nasdaq-100 is a benchmark that measures performance of companies that fit naturally into what is the new economy. For instance, the most exciting areas for economic growth are associated with the information technology space and this sector comprises around half of the capitalization of NDX. Technology is also a large part of SPX, but it comprises less than 30%. Also, note in the table below that the second largest component of NDX is Communication Services, another area that offers exposure to the modern economic trends.

New economy stocks have been great outperformers over the past decade with the total return of the NDX beating the SPX in eight of the past ten years. Even though NDX went through a difficult period following the Internet Bubble bursting in early 2000, the total return for NDX has slightly beaten that of the SPX when measuring from the last day of 1999 through the end of 2021.
NDX vs. SPX Total Return By Year 2000 – 2021
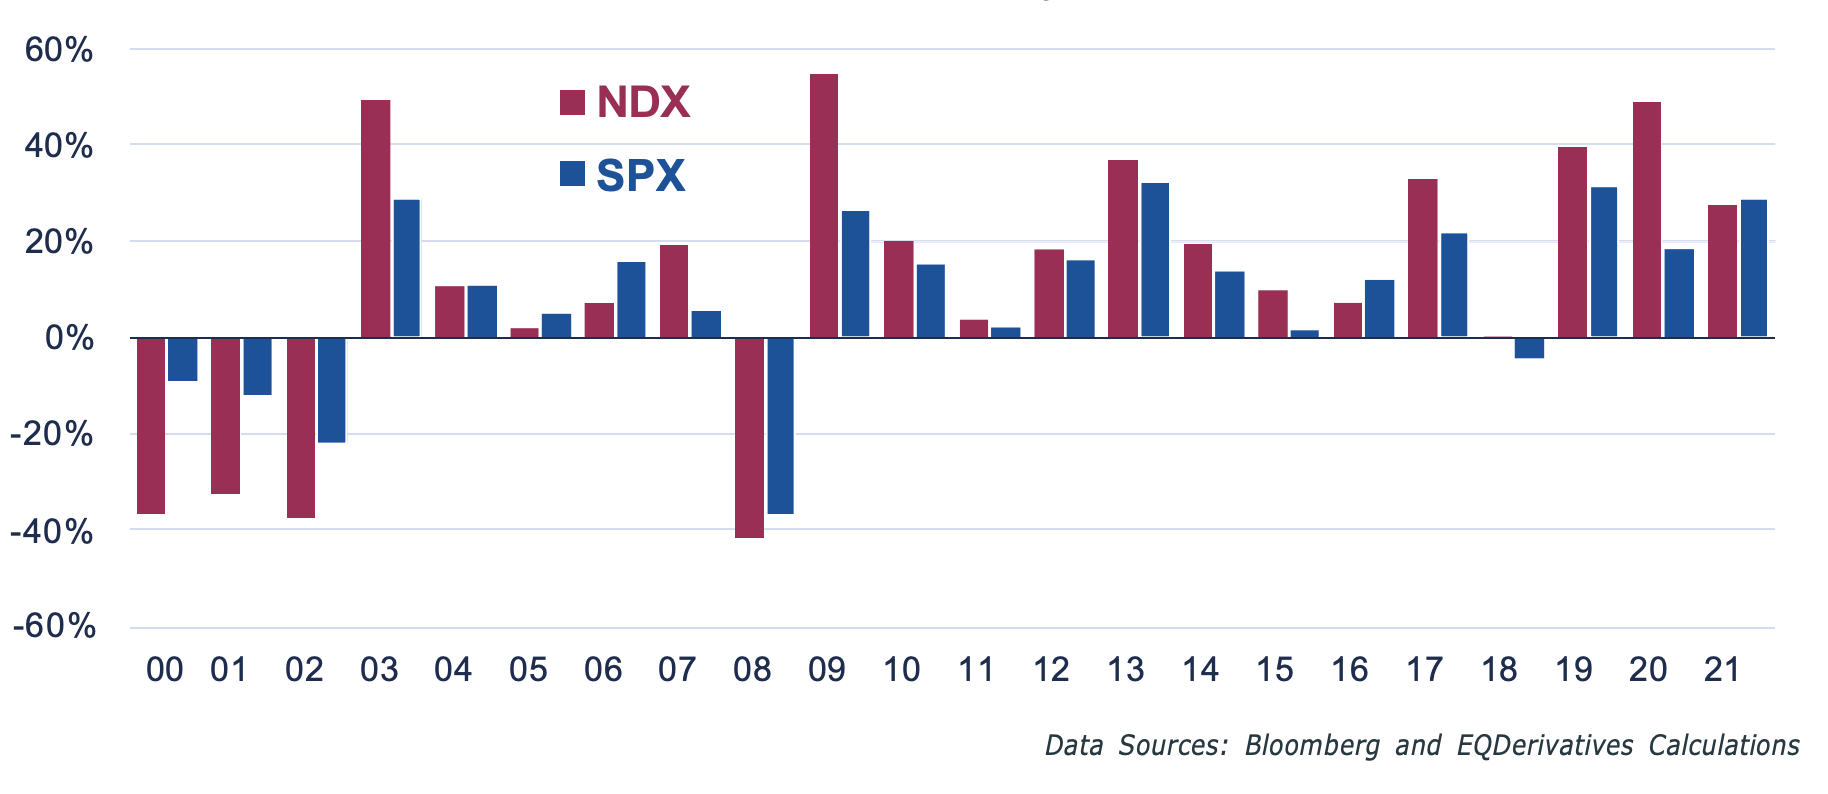
There is an academic argument that high returns are associated with elevated volatility. Historically, NDX was much more volatile than the SPX. However, this difference has narrowed over the past few years. The below chart shows realized volatility by year for both indices.
NDX vs. SPX Realized Volatility By Year 2000 – 2021
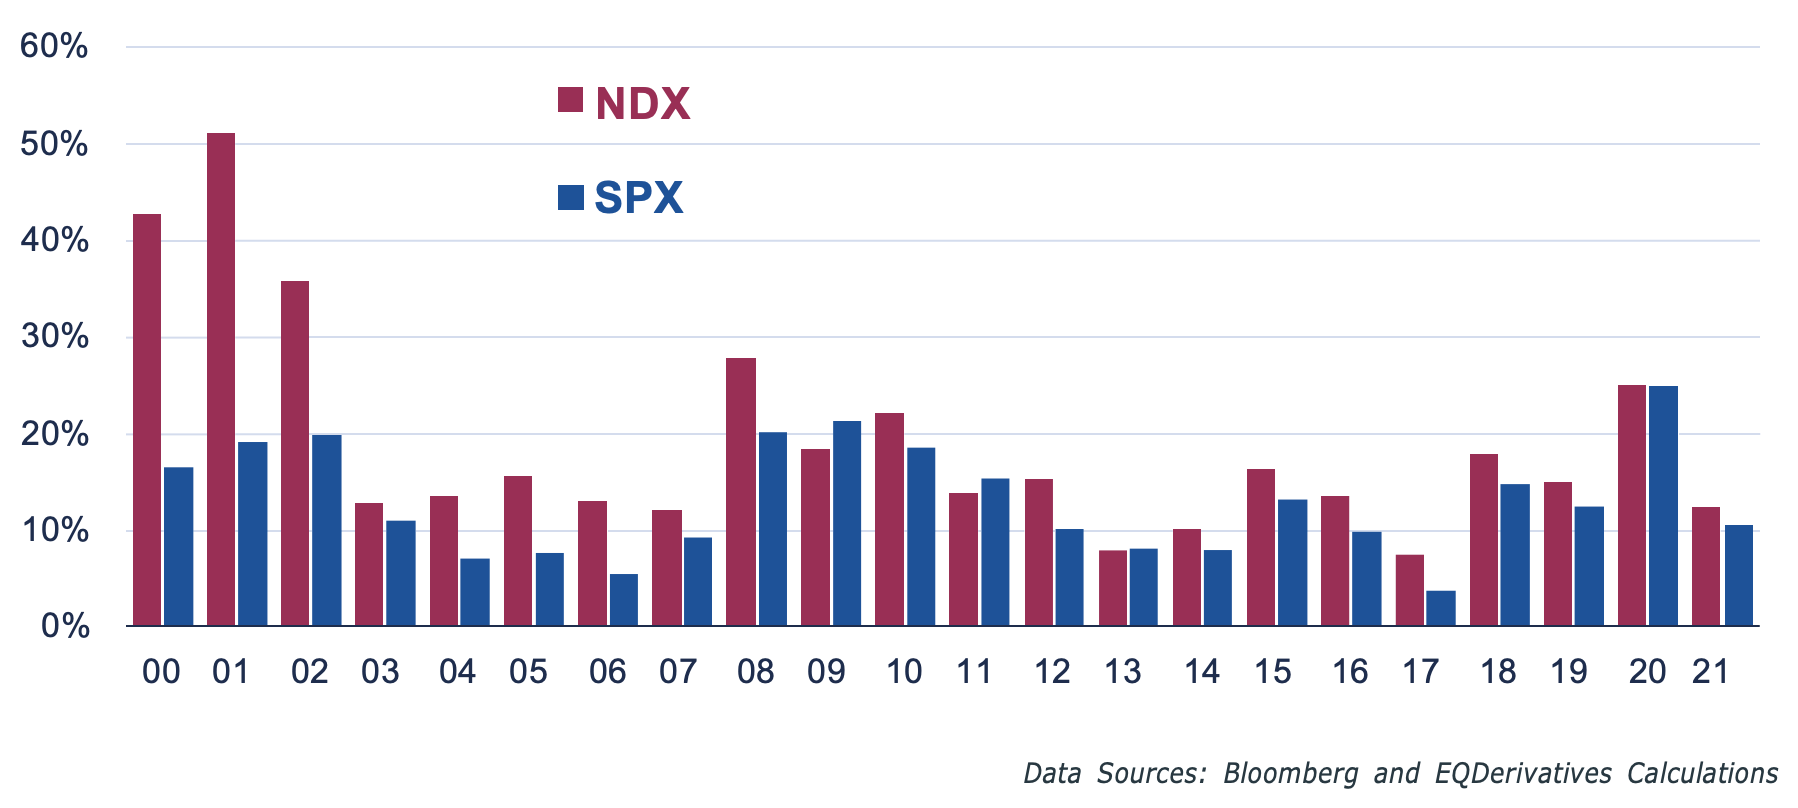
The earlier years on this chart show a dramatic difference between NDX and SPX realized volatility. From 2000 to 2002, the average realized volatility by year for NDX was 43.23% while the same calculation for SPX was only 18.40%. Fast forward to the most recent years and the average realized volatility for NDX is 17.47% versus 15.92% for SPX from 2019 to 2021. The average annual return over this three-year period heavily favored NDX at 38.61% versus 26.20% for SPX.
Even though realized NDX volatility is only slightly higher than that of SPX, the expected volatility as priced by NDX and SPX options remains slightly elevated for at-the-money (ATM) NDX options when compared to SPX pricing. The chart below uses Bloomberg’s measure of 30-Day ATM implied volatility to compare expectations priced in by both markets.
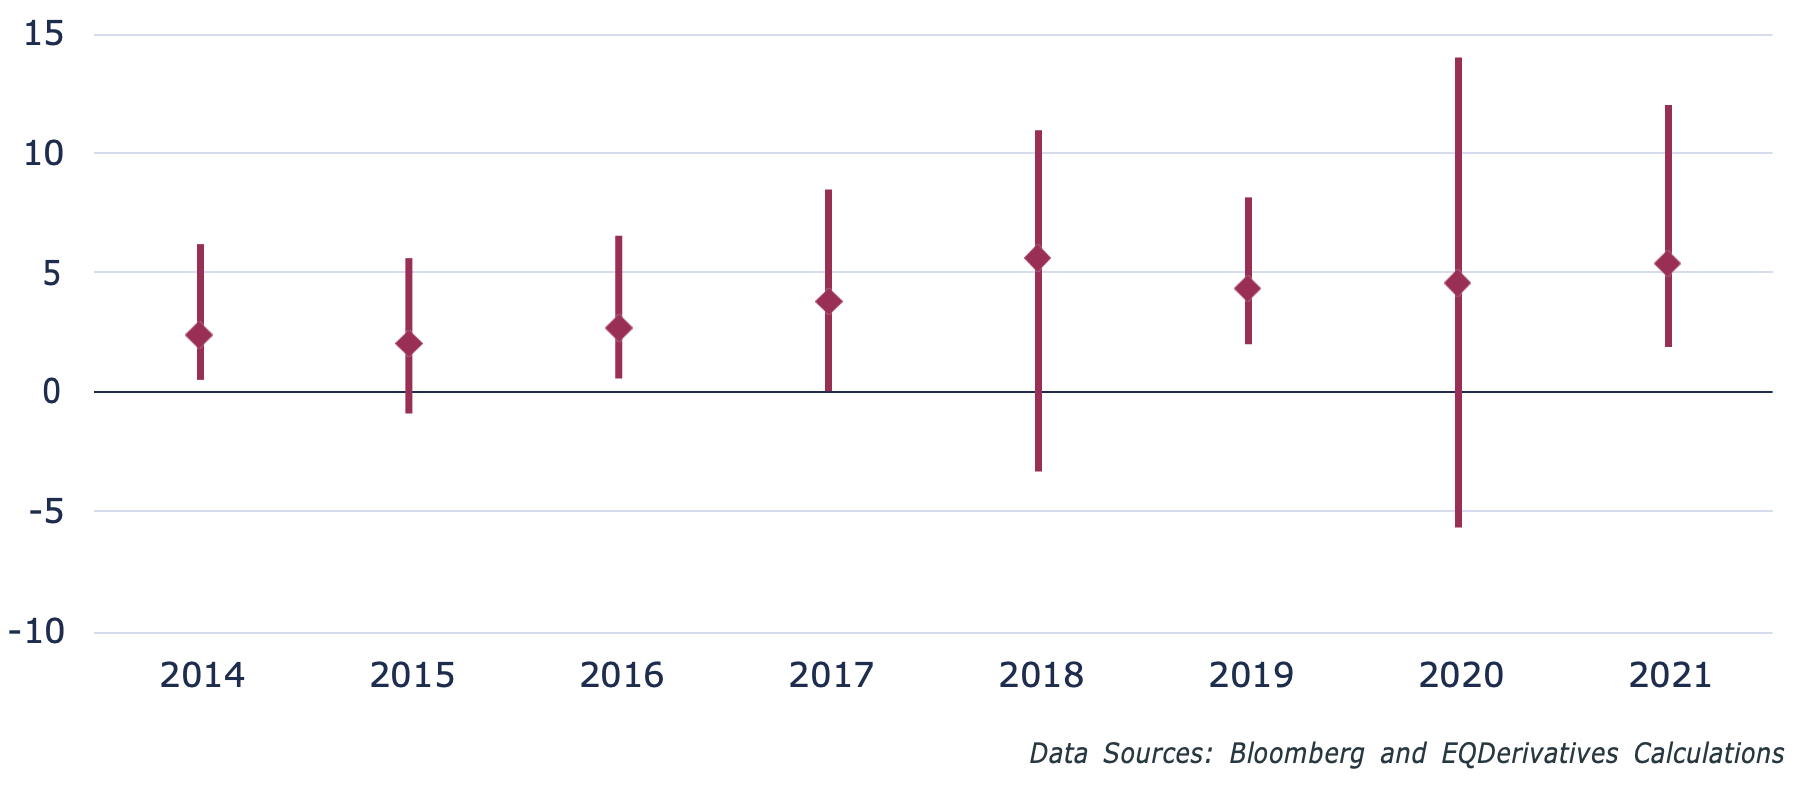
The chart specifically shows the high and low (negative in a couple of cases) along with the average spread by year. This has been trending higher over time despite realized volatility differences narrowing. Even though NDX IV is typically higher, NDX options are still appropriate for hedging purposes, especially when using a spread to sell out-of-the-money (OTM) options to help pay for protection. Later in this paper we will examine how NDX options have the potential to offer more protection at a lower price (r even better credit) than comparable SPX hedges.
NDX Seasonality
When compared to other broad based index option markets, the implied volatility as indicated by NDX option pricing has a unique reaction to earnings season. Typically, the top ten components of the Nasdaq-100 represent about half the market capitalization of NDX. These specific stocks vary over time, however, a majority of these stocks will report earnings near the end of January, April, July, and October or the first month after each calendar quarter end. With a large portion of the specific stocks reporting earnings in a consolidated time-period, inflated expected volatility from each individual stock option series influences the pricing of NDX options.
Comparing the relationship between the Nasdaq-100 Volatility Index (VOLQ) and Cboe Volatility Index (VIX) on a month-by-month basis is an efficient method of highlighting the earnings season influence on NDX option prices. The following chart shows the percent days VOLQ closed higher than VIX by month with earnings months highlighted in light burgundy and the non- earnings months represented by purple bars.
Percent Days VOLQ > VIX By Month 2014 - 2021

The long-term average (2014-2021) relationship between VOLQ and VIX results in VOLQ closing at a premium to VIX 60.84% of days. This figure drops to 56.84% during non-earnings months and rises to 70.34% during months where NDX components report earnings. Also, all four earnings months stand out as having a majority of days where VOLQ closes at a premium to VIX.
Another impact of earnings shows up in the relationship between the implied volatility of Nasdaq-100 components and NDX index options. The following chart shows the average spread between the average 30-day implied volatility for the largest ten NDX components and NDX index options for strikes 95%, 100%, and 105% of the price of the underlying securities.
Average Component IV Minus NDX IV By Month 2014 - 2021
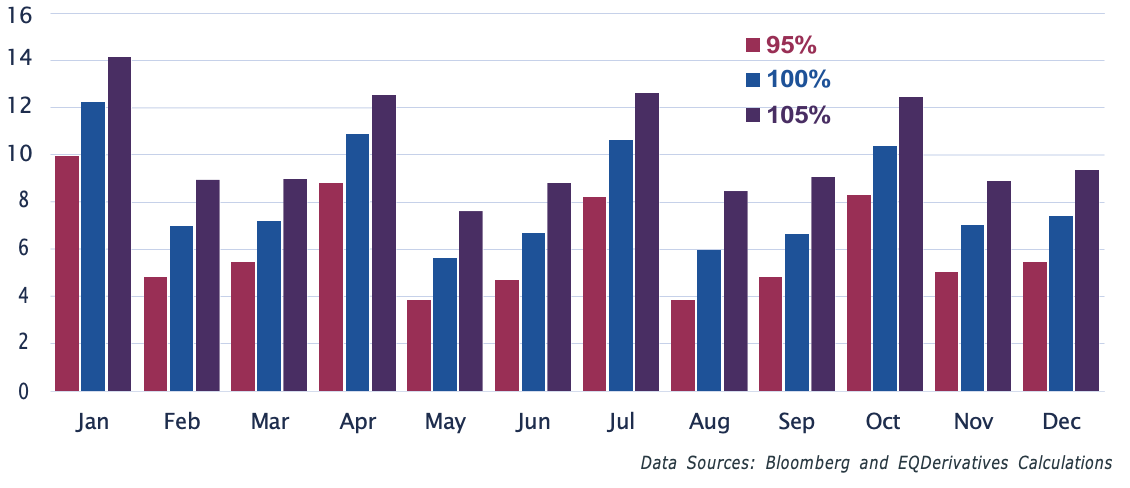
Again, this chart segments months to show the difference between earnings and non-earnings months. Note the largest spread, determined by subtracting NDX implied volatility from the average for the large NDX components, is widest during the earnings months of January, April, July, and October. Also, volatility priced in at the 105% price level, representing 5% out of the money to the upside, is consistently wider than that of the 100% and 95% levels.
This breakdown of component versus NDX index implied volatility is of the greatest interest to dispersion traders. A dispersion trade will take a position in options on an index and an offsetting position in options on components of the index. This strategy has become more popular among sophisticated derivative traders in the past few years.
On a daily basis more put than call options trade on broad based indexes which is unique to this part of the listed option markets. The reason for this increased use of puts, when compared to other markets, is index options are a cheap and efficient method of hedging an equity portfolio. Many managers automatically default to SPX options, but this may not be the best choice to hedge an equity portfolio.
In mid-2020, UBS published a list of equities that were most widely owned by institutions. Those companies appear in the table below.

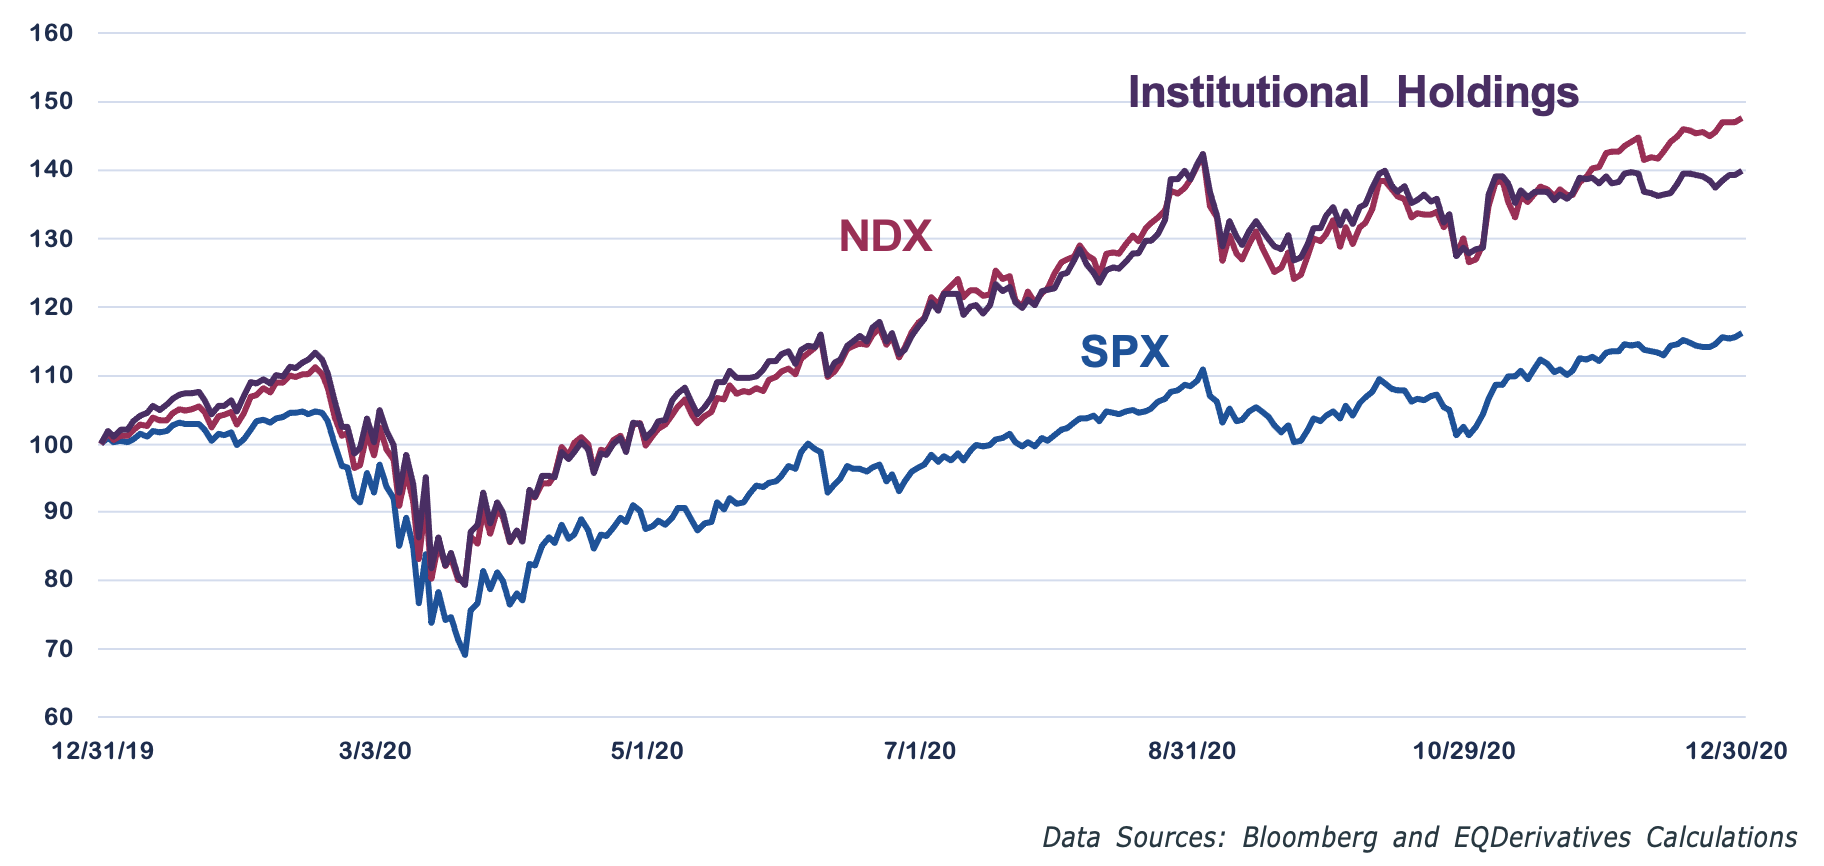
Several of the names appearing on this list are large Nasdaq-100 components. Also, the correlation between an equal weighted portfolio holding this group of stocks and NDX was 0.96, slightly higher than a correlation of 0.94 between this portfolio and the S&P 500. More importantly, during 2020, this portfolio’s performance closely mirrored that of the Nasdaq-100 while there was a definitive divergence between the S&P 500 and the institutional portfolio. The following chart shows the daily performance for both indices and the institutional portfolio.
SPX / NDX / Top Institutional Holdings Portfolio Daily 2020
Structured Outcomes
Creating a structured outcome using options is another use that continues to gain traction. NDX options consistently price in higher volatility than the comparable broad based index option market, which makes them ideal for creating a spread with a structured outcome. The following two examples compare combining a long portfolio with a short call that is 5% out of the money, long put that is 5% out of the money and a short put farther out of the money that will take in enough premium for the trade to be implemented at a near zero cost.
For example, on June 30, 2021, the S&P 500 closed at 4297.50. A portfolio manager holds an S&P 500 portfolio and is concerned about the second half of 2021. They decide to implement a zero cost hedge using SPX options expiring on Dec 17, standard December expiration. The specific strategy sells the SPX Dec 4500 Call for 72.65, buys a SPX Dec 4075 Put for 125.15, and completes the trade by selling the SPX Dec 3575 Put for 52.95 with the result being a small credit of 0.45.
On the same date, a portfolio manager who has exposure to the Nasdaq-100 is also concerned about the second half of 2021. With NDX at 14554.80 the manager sells the NDX Dec 15275 Call for 450.60, buys the NDX 13875 Put for 562.15, and completes the trade by selling the NDX 10725 Put for 111.70 resulting in a credit of 0.15. The following table summarizes both trades.

Both hedges look similar until digging into the respective strike prices for the puts sold to cover the cost of the transaction. Each short put dictates the amount of downside coverage the managers receive from these trades. The long put will protect against losses greater than 5%, but that protection only covers losses through the short strike. The short SPX put has a strike price of 3575. This is about 16.8% lower than where the S&P 500 was at the end of June. The short NDX put has a strike price of 10725, 26.3% lower than where NDX was on June 30. The NDX version of this hedge gives the manager almost 10% more downside protection that the comparable SPX version. The payoff diagrams below compare the two strategies if held to expiration.
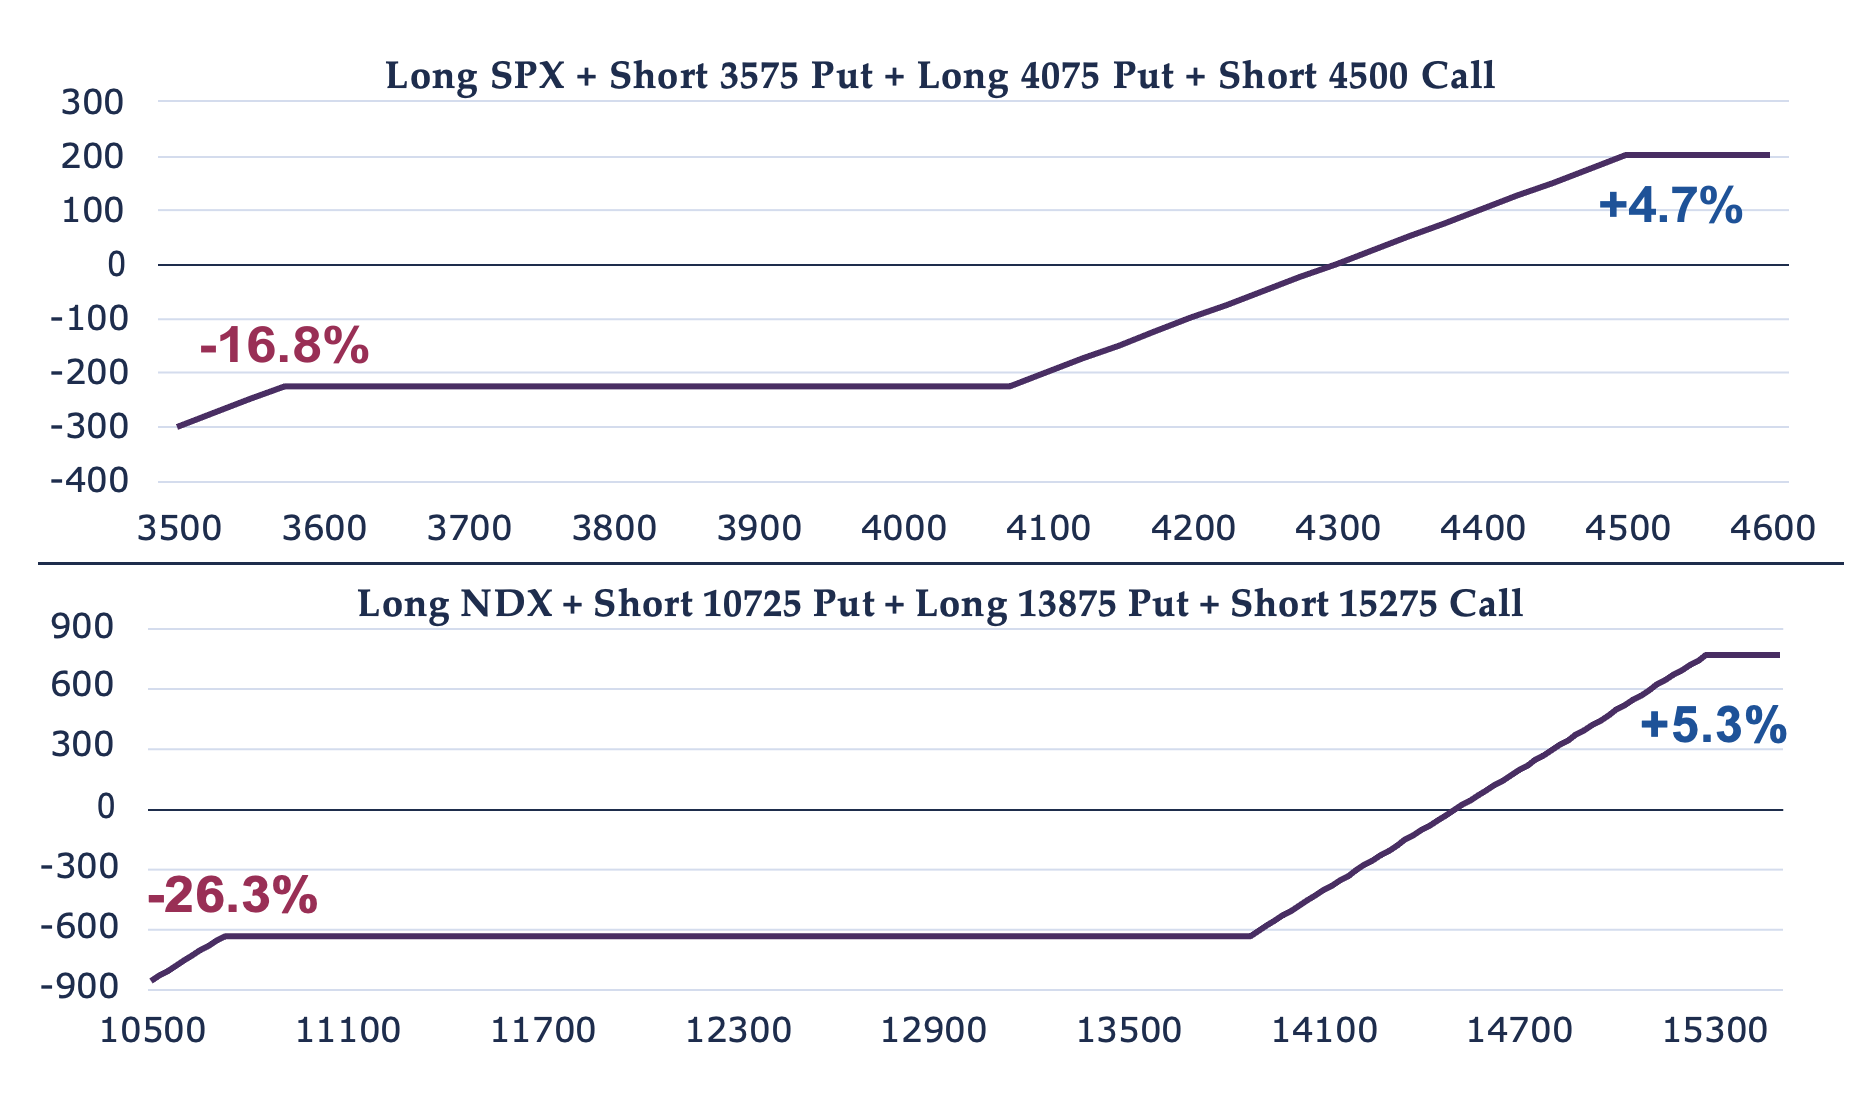
One alternative to the example above might involve selling a higher strike NDX put to match the protection offered by the SPX hedge. The short put strike in the SPX hedge is 16.8% lower than where the market was trading. The closest NDX strike price to this level is 12100 and the NDX Dec 12100 Put is at 227.35. Selling this put, buying the NDX Dec 13875 Put for 562.15 and selling the Dec 15275 Call results in a credit of 115.80 or about 0.8% of the NDX level on June 30.
Finally, in this example, we explored the pricing for a hedge that allows 7.5% NDX upside instead of 5%. This transaction would sell the NDX Dec 15650 Call for 315.80 and once again purchase the NDX Dec 13875 Put for 562.15. To complete the trade that allows 7.5% upside the NDX Dec 12250 Put is sold for 245.95 resulting in a cost of 0.40. The result of this trade is downside protection between down 5% and 15.6%, but allowing for more upside than the SPX trade by selling a farther out of the money call. The following graphic shows the payoff at expiration for these two alternatives.
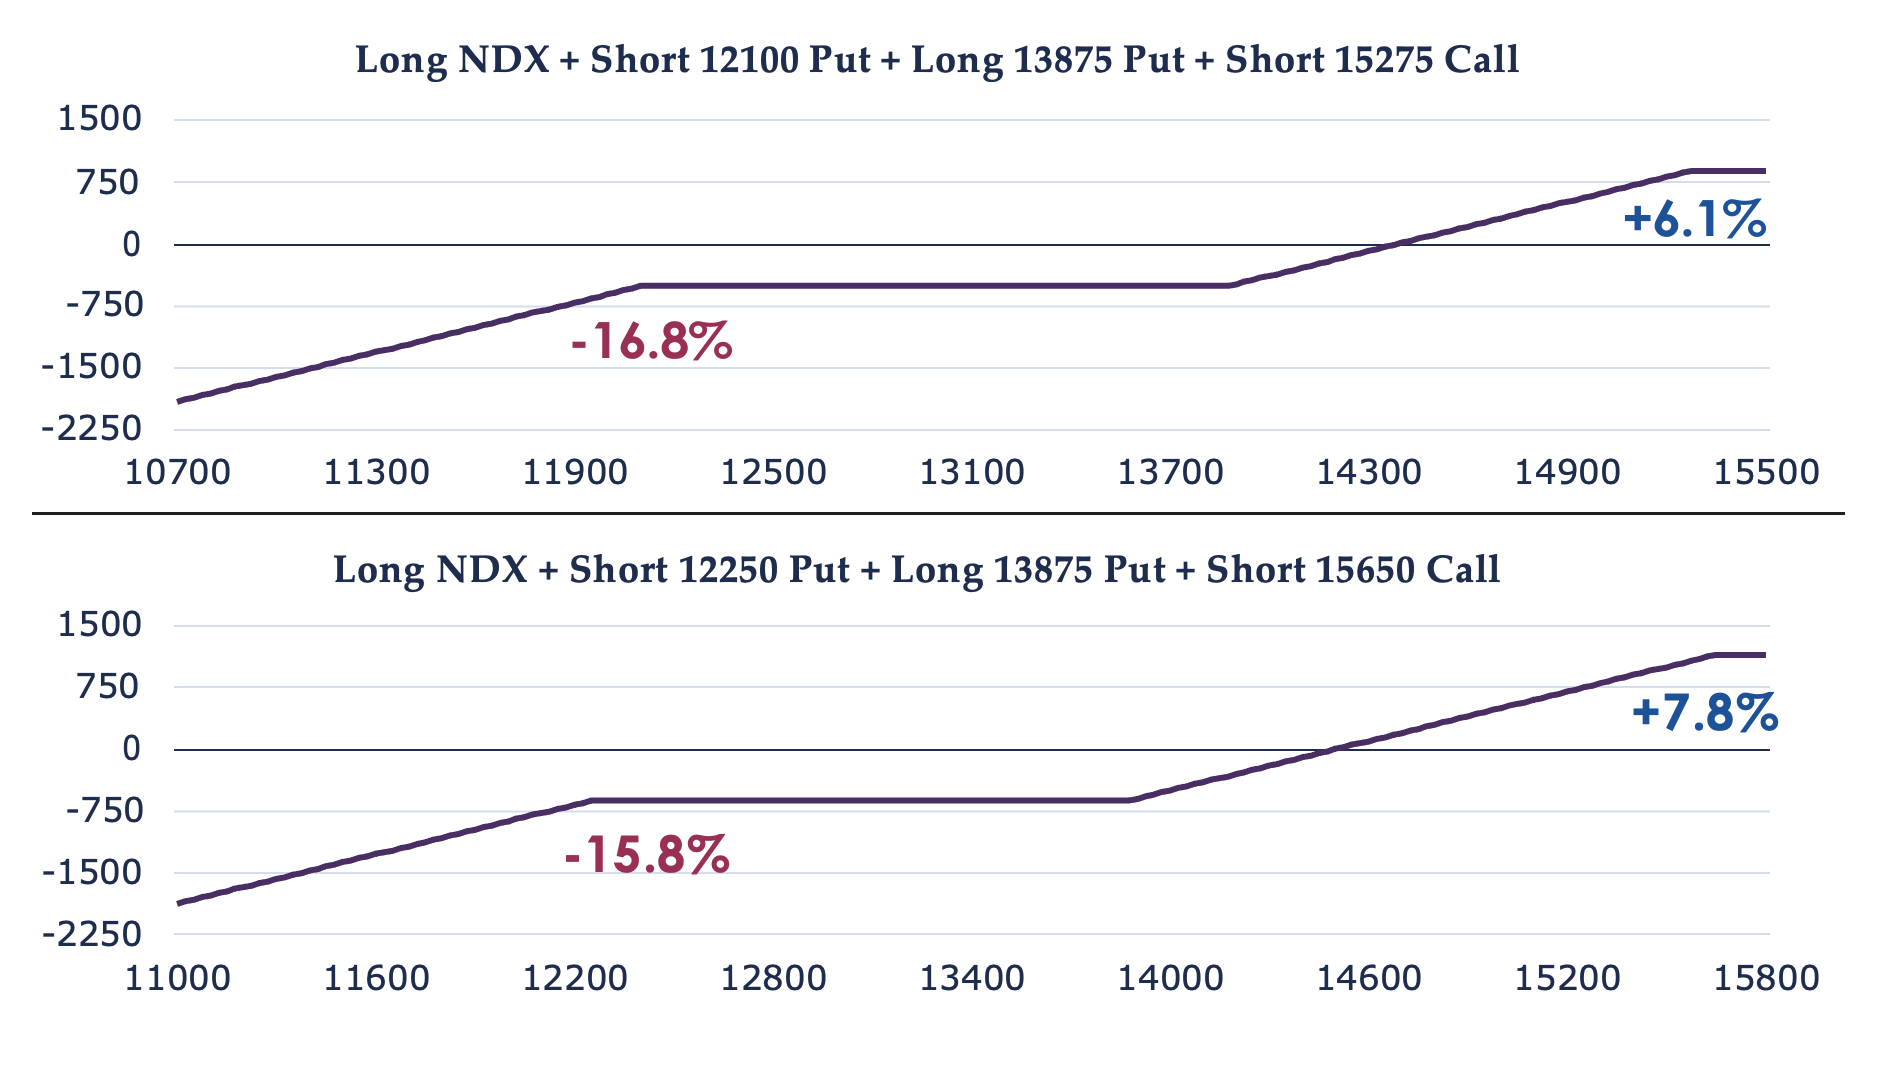
When we adjust the short put strike for a loss of 16.8%, matching the SPX example, there is a bit more upside due to the credit of 115.80 received when implementing the trade. The other alternative allows 7.8% of upside and protects against a loss of down about 5% to 15.8%. Recall, the realized NDX volatility has been comparable to SPX in the past few years, but despite this more upside is available using NDX options than SPX options to hedge a portfolio.
Although this example shows a low-cost hedge, this type of spread is common with structured products that limit potential profits, but also mitigate losses. These strategies in an ETF format mostly use SPX options, but NDX does offer a superior alternative due to higher out of the money implied volatility on both the upside and downside relative to market prices.
The Nasdaq-100 components represent companies that are on the cutting edge of technology and economic growth. Many portfolio managers are overweighting these type of companies due to the promise of continued outperformance. NDX options are the best vehicles for managers to hedge or speculate on the specific outlook for these type of firms.
About EQDerivatives
EQDerivatives is the premier provider of volatility derivatives and alternative risk premia news, research and event content for investors, portfolio managers and service providers. We connect and educate the leading thinkers in the space globally by delivering the latest strategies from the practitioners buying and structuring investments. EQD’s data reports are recognized as the definitive source of market intelligence across derivatives markets, quantitative investing and ESG. Through a curated network of portfolio managers, execution traders, CIOs and heads of asset allocation at institutional investors, EQD can map global markets and products through the lens of the buyside.To learn more, visit https://eqderivatives.com/research/derivatives-data.
Copyright EQDerivatives, Inc. 2022.
Content published by EQDerivatives, Inc. may not be copied or otherwise reproduced, repackaged, further transmitted, transferred, disseminated, redistributed or resold, or stored for subsequent use for any commercial purpose, in whole or in part, in any form or manner or by any means whatsoever, by any person without EQDerivatives’ prior written consent.
The views and opinions expressed herein are the views and opinions of the author and do not necessarily reflect those of Nasdaq, Inc.
