
A Record Russell Recon Is Coming
Next Friday (June 26), FTSE Russell will implement their usual annual index reconstitutions.
Typically the biggest close trade of the year
In contrast to other indexes, Russell does most of its changes just once a year (most other indexes do significant quarterly changes). That’s meant to reduce turnover, reducing the impact of quarterly stock price moves that affect a stock’s rank. But it means the changes aggregate into a single, more significant event, as they have built up for an entire year.
At the end of next Friday, Russell will switch stocks between value and growth, large and small cap, add new companies and remove companies that no longer qualify. It will also update free float and shares outstanding for all constituents. There is a lot going on, and more than 3,000 tickers will be affected.
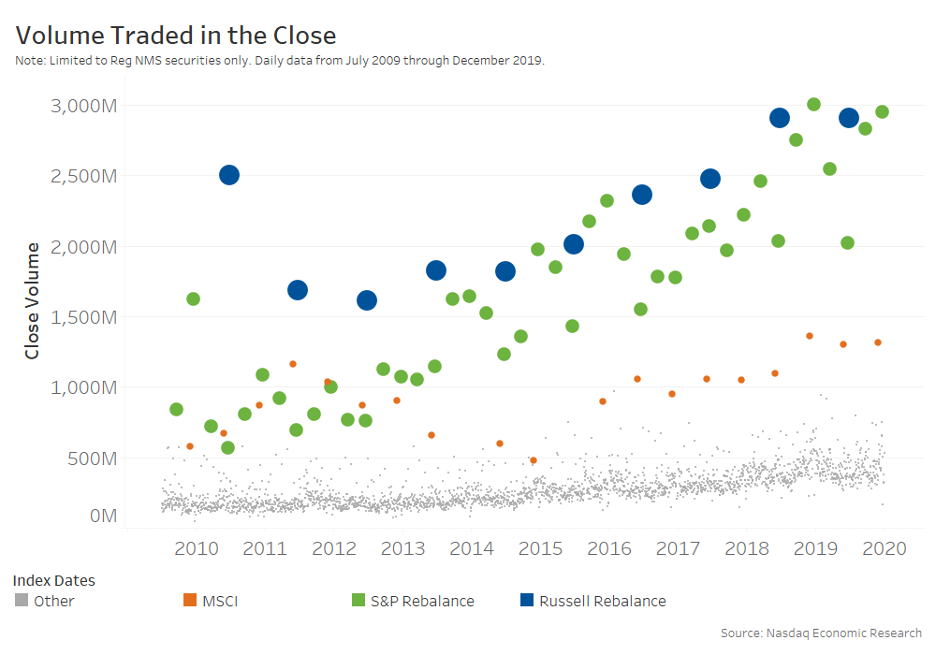
Chart 1: The Russell Reconstitution is typically the biggest market close of the year
Almost $100 billion in trading for index funds
Credit Suisse estimates that the 2020 FTSE Russell changes will generate almost $100 billion of index trading, more than double the roughly $40 billion that indexers need to trade for the S&Ps quarterly rebalance this Friday (June 19).
Given the scale of the difference, the way S&P has caught up to Russell in Chart 1 is a little misleading. That’s because S&P intentionally synchronize their quarterly review to coincide with “triple-witching,” when futures and options expiries also occur. S&P does that because expiry brings additional liquidity to the market on that day, which may help reduce index transaction costs, although the data here indicates witching might account for more liquidity than the S&P rebalance itself.
In contrast, last year it was estimated that Russell indexers needed to trade 1.2 billion shares in Nasdaq-listed names and we saw 1.3 billion shares trade in our closing auction. So the Russell recon close is dominated by the 3,000-plus names that are included in Russell’s indexes. That is in contrast to what we’ve noted about normal closes, where indexers are a fraction of all trading.
Chart 2: Almost all of the annual trading in indexes happens on reconstitution dates
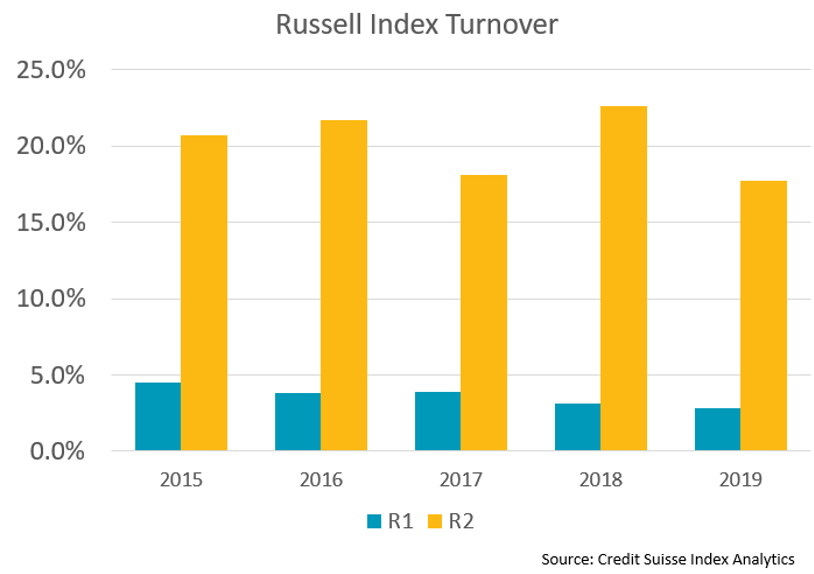
Although this seems like a lot of trading, in reality, index funds don’t trade much each year. In fact, the data shows Russell’s large cap index recon turnover has been below 5% the past five years (at least). Turnover in Russell’s small cap 2000 index is higher, primarily because each year the largest companies “promote” (or in Russell terminology, migrate) to the large cap index.
To put this in perspective, this year’s cutoff between large and small cap is around $3 billion in market cap. That’s much smaller than the $1 trillion market cap in AAPL and AMZN, but much larger than the smallest stocks added to the Russell 2000 index, which extends to companies with $95 million in market cap.
Chart 3: The small cap index changes are most impactful to corporates
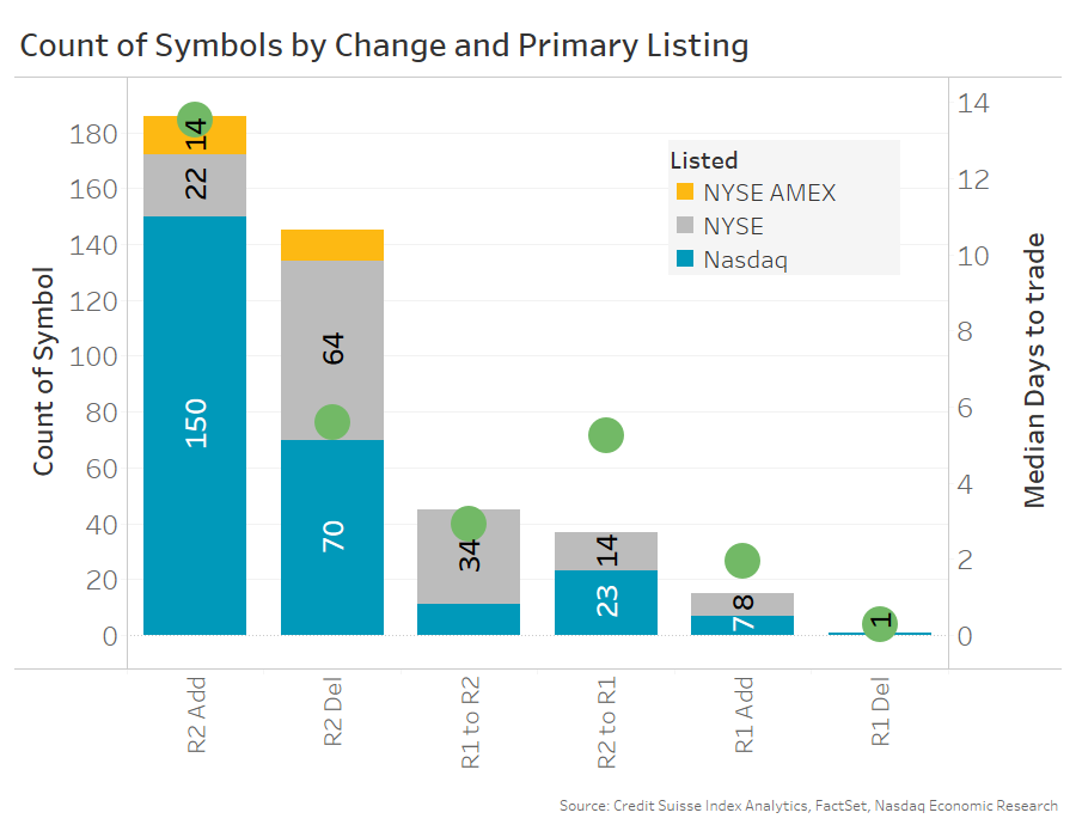
Data also shows that small-cap stocks are disproportionately affected by the Russell reconstitution. You can see that small-cap trading is far greater than large cap trading (“R2” green dots). There are a couple of reasons for that.
- First, liquidity in smaller stocks is often lower than for larger cap stocks.
- It’s also estimated that Russell’s market share in the small-cap space is more than double their market share in the large-cap space.
That means Russell index funds will end up owning (or selling) more of the total shares outstanding in small cap companies.
In fact, somewhat counterintuitively, a “promotion” (R2 to R1) is actually a net sell, as there are more small-cap indexers selling than large cap indexers buying.
Index funds trade all at once; the market provides liquidity to them
For issuers, there are a few important facts to consider.
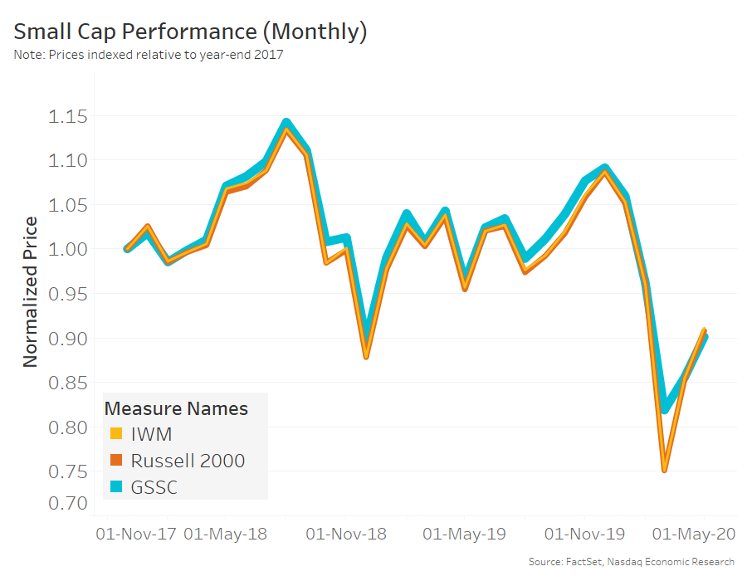
First, most index funds trade on the exact same date that the index changes. That’s because holding non-index stocks adds too much risk (seen as tracking error) to portfolio performance. You can see from Chart 4 just how closely IWM ETF tracks its Russell 2000 benchmark (yellow and orange lines). In contrast, the actively managed GCCS ETF, which also holds small cap stocks, deviates from the Russell 2000 performance, sometimes outperforming significantly.
That means that, although there will be index selling for deletes next Friday, any “overhang” in the stock should be mostly removed once the reconstitution is completed.
Chart 4: Tracking error is tightly controlled by indexers
Second, although Chart 3 shows a significant amount of buying and selling is expected on June 26, the industry does a good job of forecasting and facilitating index demand.
In fact, despite the huge volumes, the annual Russell reconstitution is usually a relatively orderly close. A few stocks typically see some market impact late in the day, but in general the index trades are matched up pretty well by liquidity providers. That highlights how efficiently today’s competitive markets work.
That in turn means selling pressure on deletes has mostly already occurred. In fact, Credit Suisse reports the spread between small cap adds and deletes, where adds were outperforming deletes by around 10% at the end of May, has recently closed as oversold R2 deletes joined the COVID recovery rally.
For companies, that means the impact from index trading is already mostly priced in to your stock. In fact, the conclusion of the reconstitution usually marks the end of the headwind (or tailwind) your stock may have been facing.
A record close in record time
Matching all this liquidity in the close creates the single biggest auction we see each year.
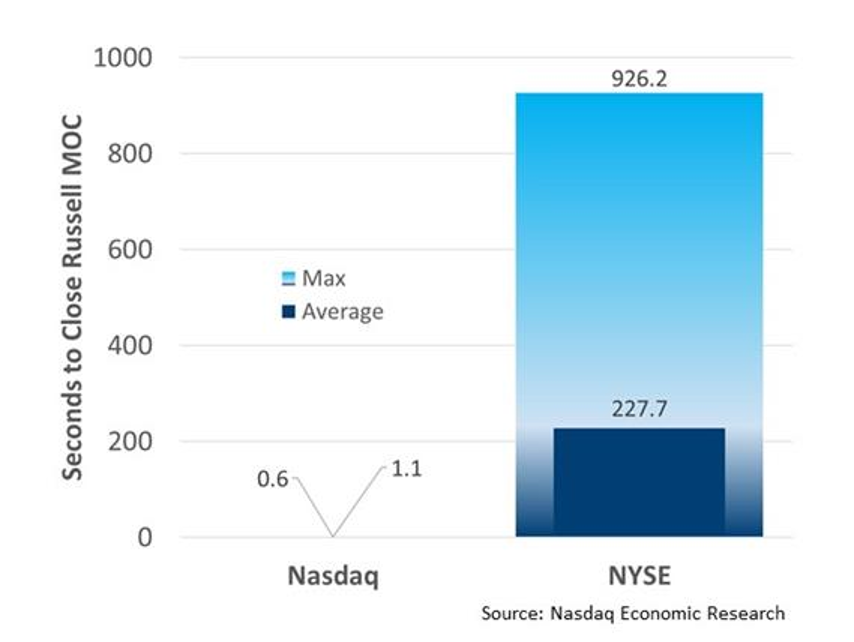
Although this spike in volume slows our matching engines down a little, last year we processed closes for all 2,765 Nasdaq-listed stocks, representing $43 billion across 1.3 billion shares and more than 1.1 million orders in just over one second.
Chart 5: Nasdaq’s electronic close last year completed $43 billion across 1.3 billion shares in one second
This year we’re expecting to see an even larger 1.5 billion shares from indexers in the close.
Thanks to how brokers forecast changes and liquidity providers pre-position for index funds, the Russell close does not put a wrinkle into smoothly operating markets.
