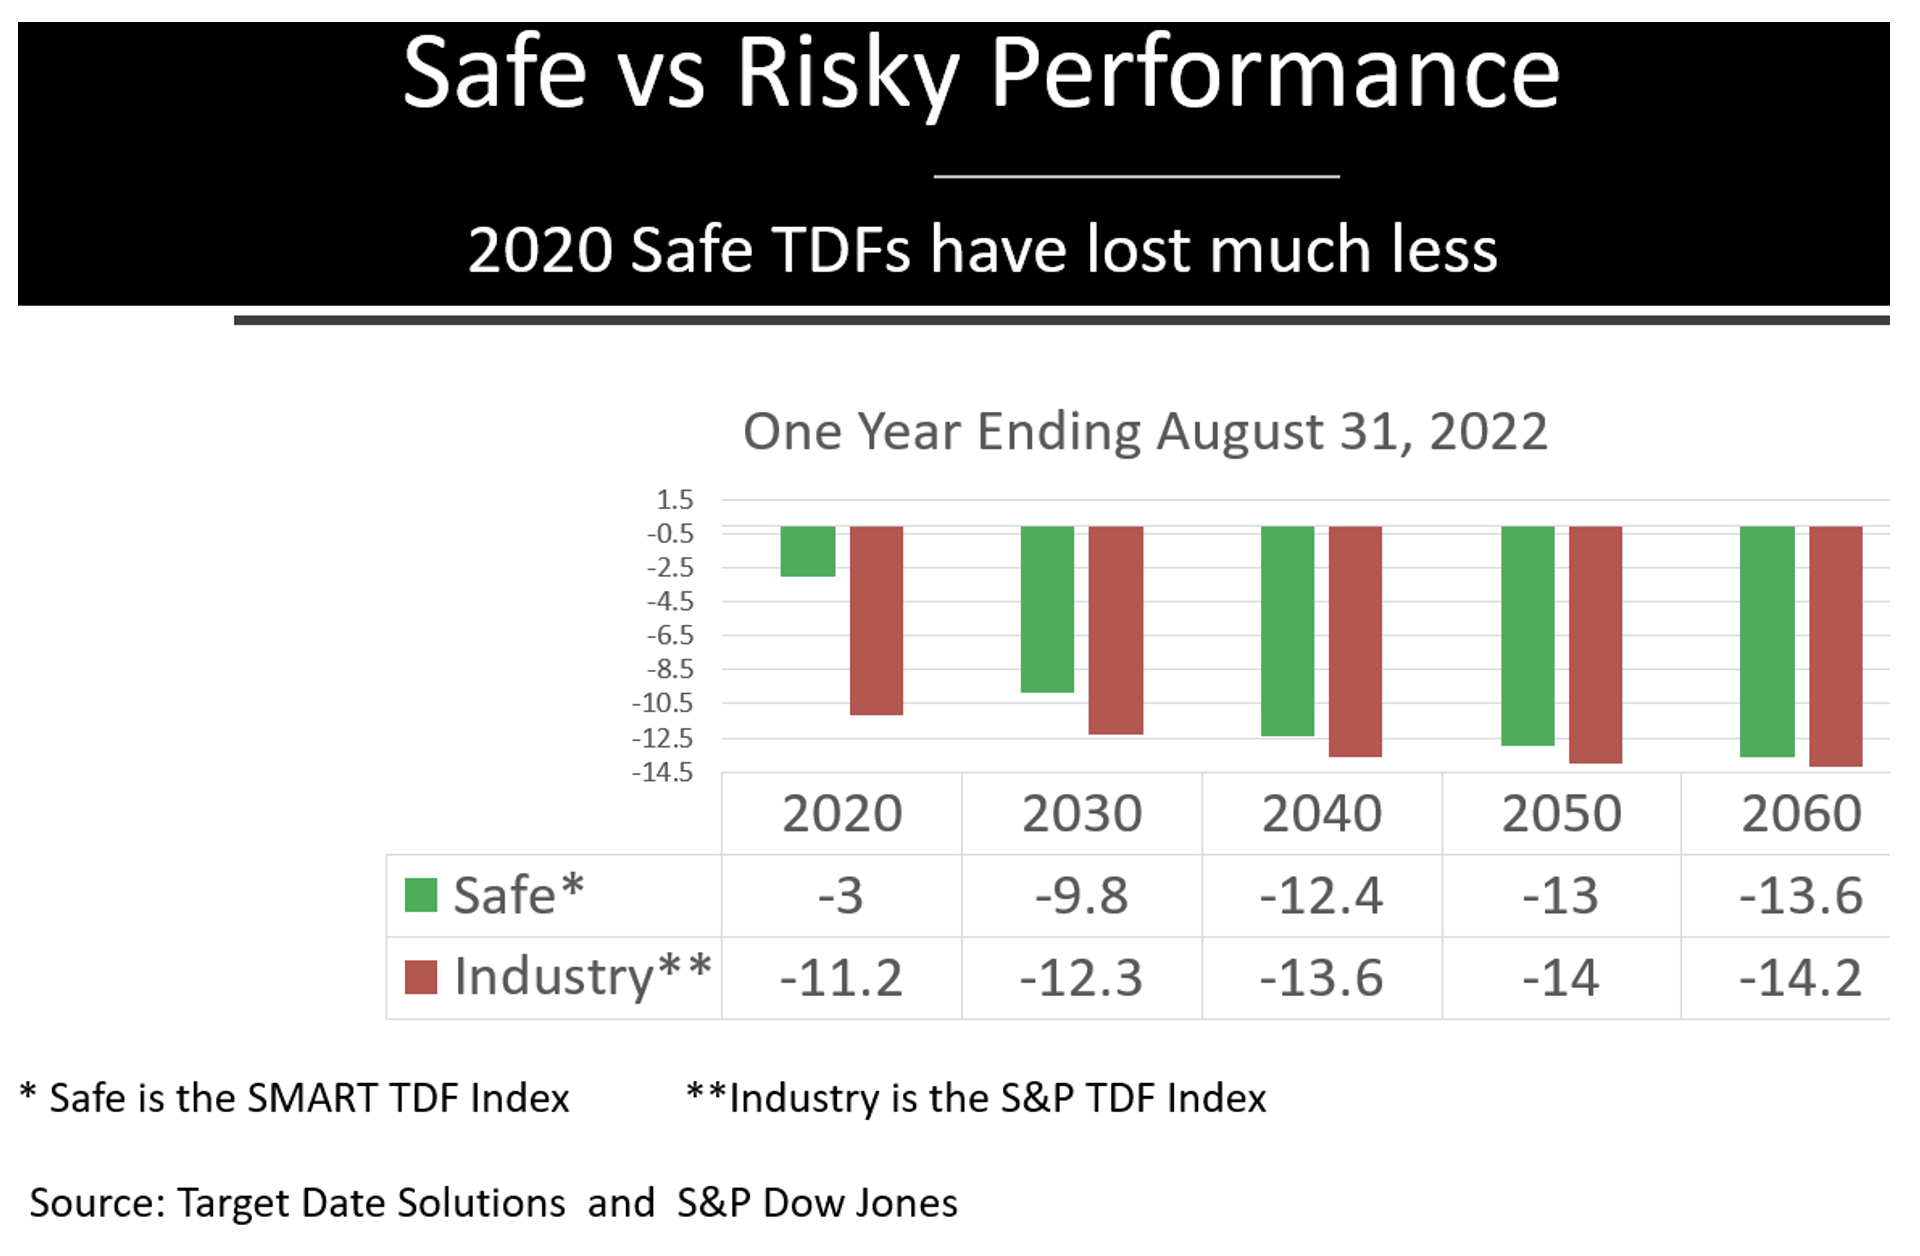
- The TDF industry is a Risky group. Its 2020 TDFs lost 11.2% in the year ending August 2022 while its 2060 funds lost 14.2%, about the same.
- There is a Safe group of TDFs whose 2020 funds lost 3% and 2060 funds lost 13.6%
- The Safe group protects by holding less equities and by defending with very safe assets, while the Risky group “defends” with risky long-term bonds.
Target date funds (TDFs) are the big deal in 401(k) plans, constituting about half of plan value. They are supposed to become safer as the target retirement date approaches, so in declining stock markets near-dated funds should lose much less than far-dated, but that’s not what happened in the year ending August 2022, as shown in the following.
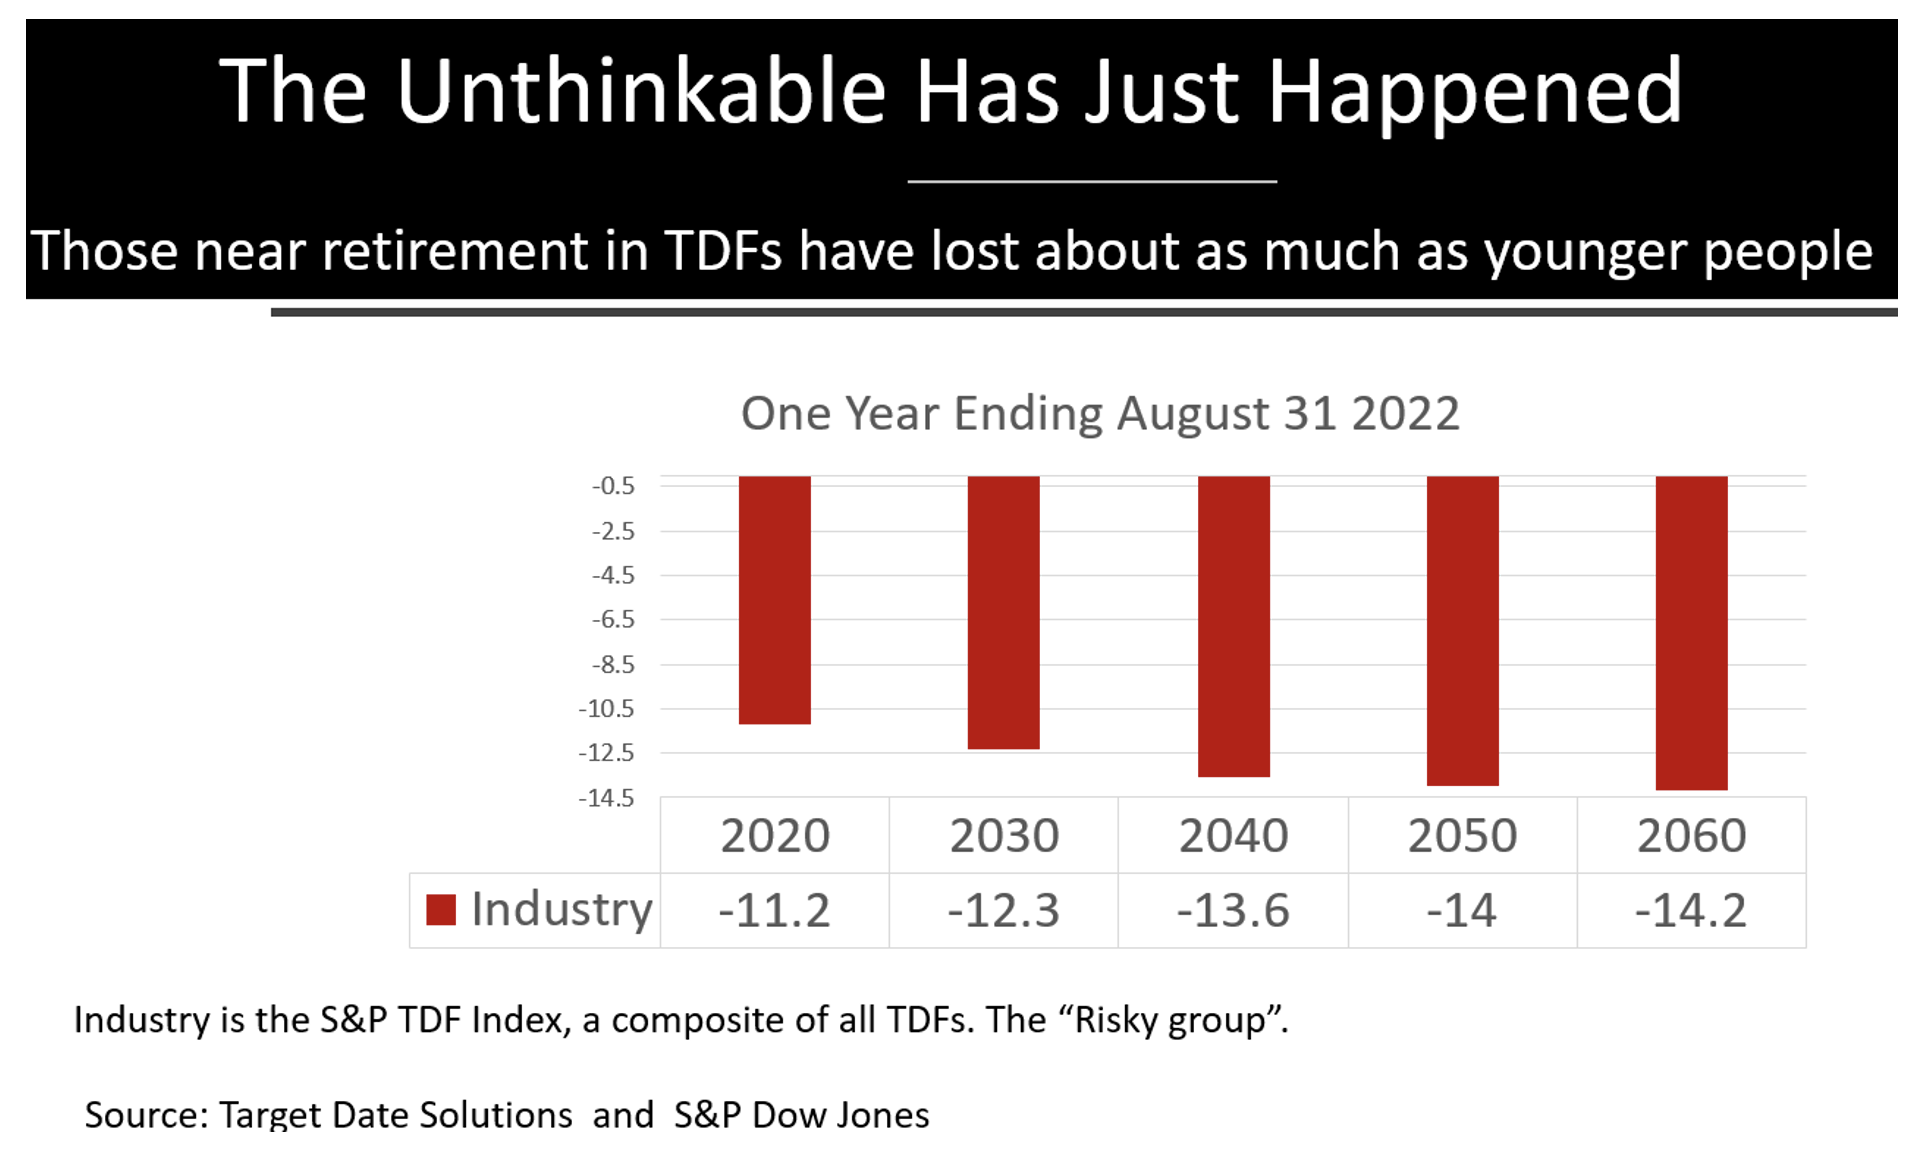
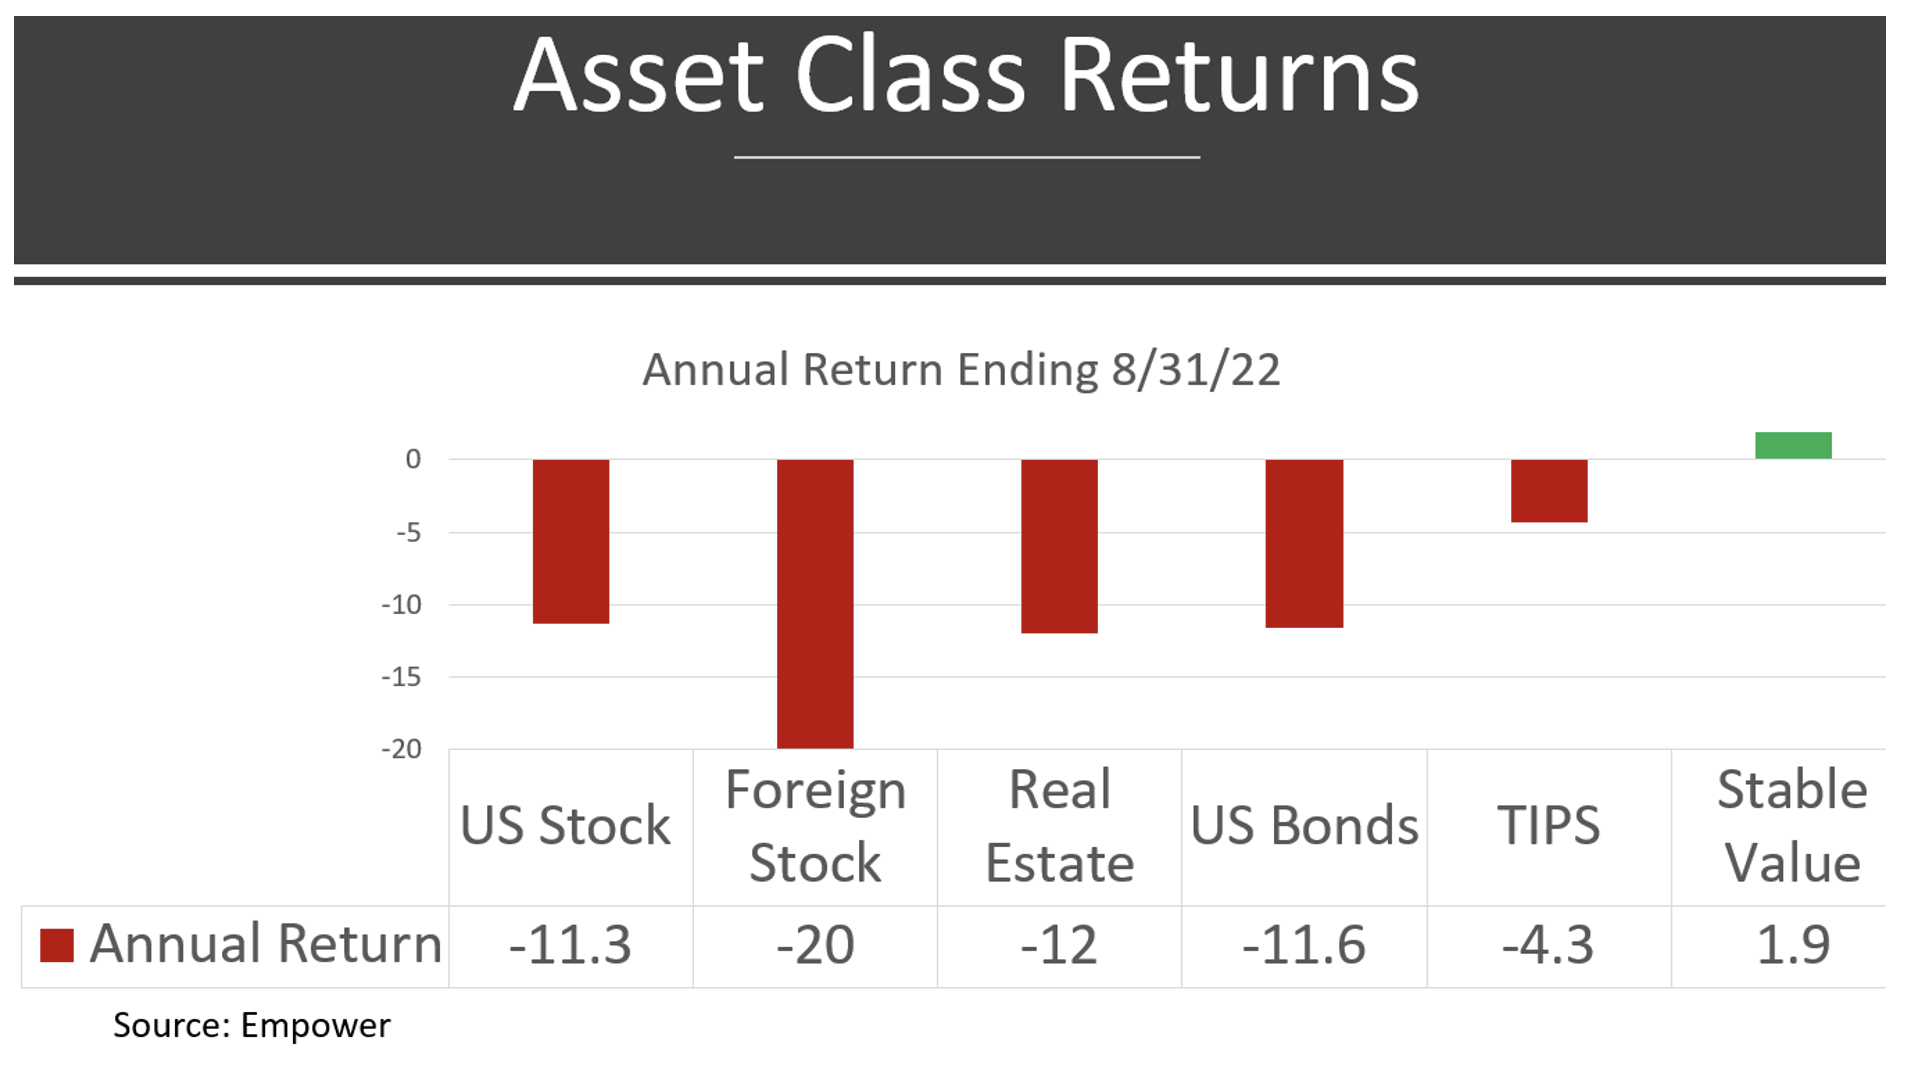
Have you figured out this puzzle? Here’s what has happened. With interest rates near zero, but on the rise, bonds have become risky, and have recently lost even more than stocks, as shown in the following graph.
The blunder
Target date funds “defend” with long-term bonds. This has worked in every year that stocks were down, until now. When both stocks and bonds go down together, observers say they are correlated; this rarely happens and when it does bonds have gone down less than stocks, until now.
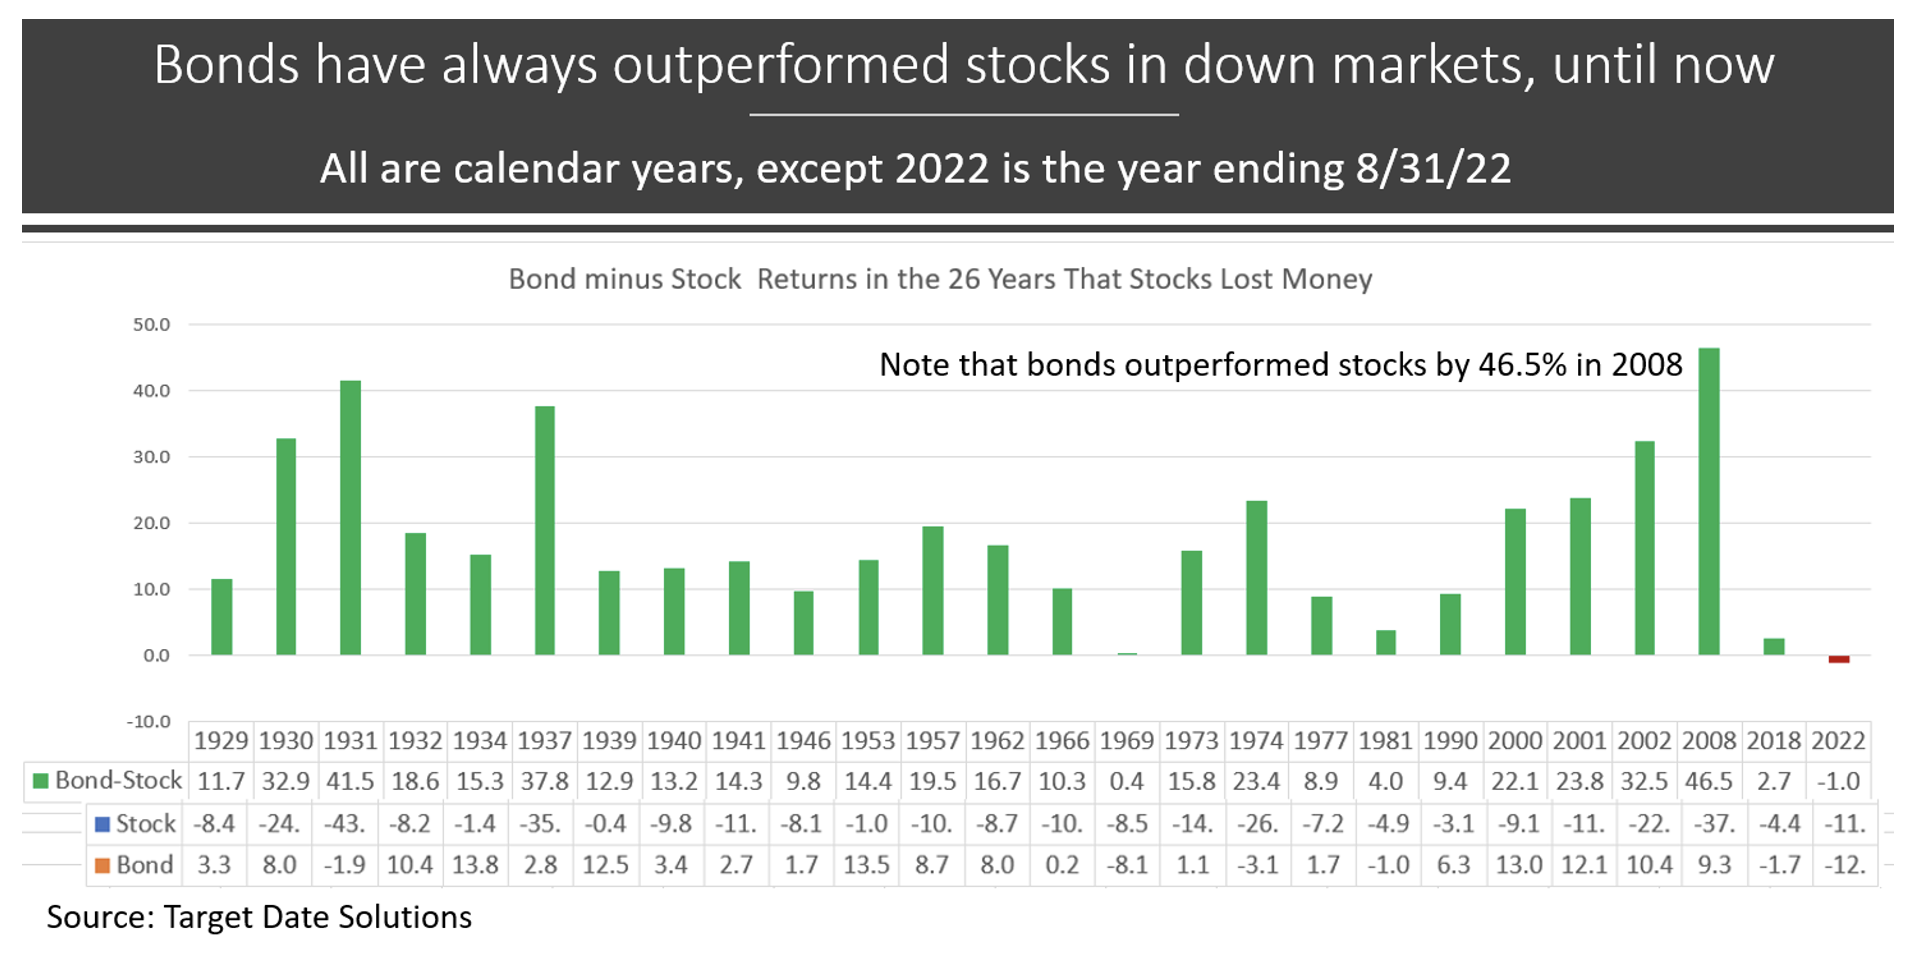
Bonds could easily continue to lose more than stocks because the Federal Reserve is easing off of its Zero Interest Rate Policy (ZIRP) in order to fight inflation. It’s called Quantitative Tightening (QT). When bond prices are left unmanipulated, bonds yield 3% above the rate of inflation, so 12% when inflation is 9%. If interest rates increase by 10% from the current 2% to 12%, bond prices will fall 60%.
Better protection
Most don’t know this, but there are actually two groups of TDFs: Safe and Risky. Most TDFs are in the Risky group. The Safe group is anchored by the Federal Thrift Savings Plan (TSP) , the world’s largest savings plan, and is joined by the Office & Professional Employees International Union (OPEIU), one of the largest AFL-CIO unions, and by the SMART Target Date Fund Index.
Here are the asset allocations at the target date for the two groups:
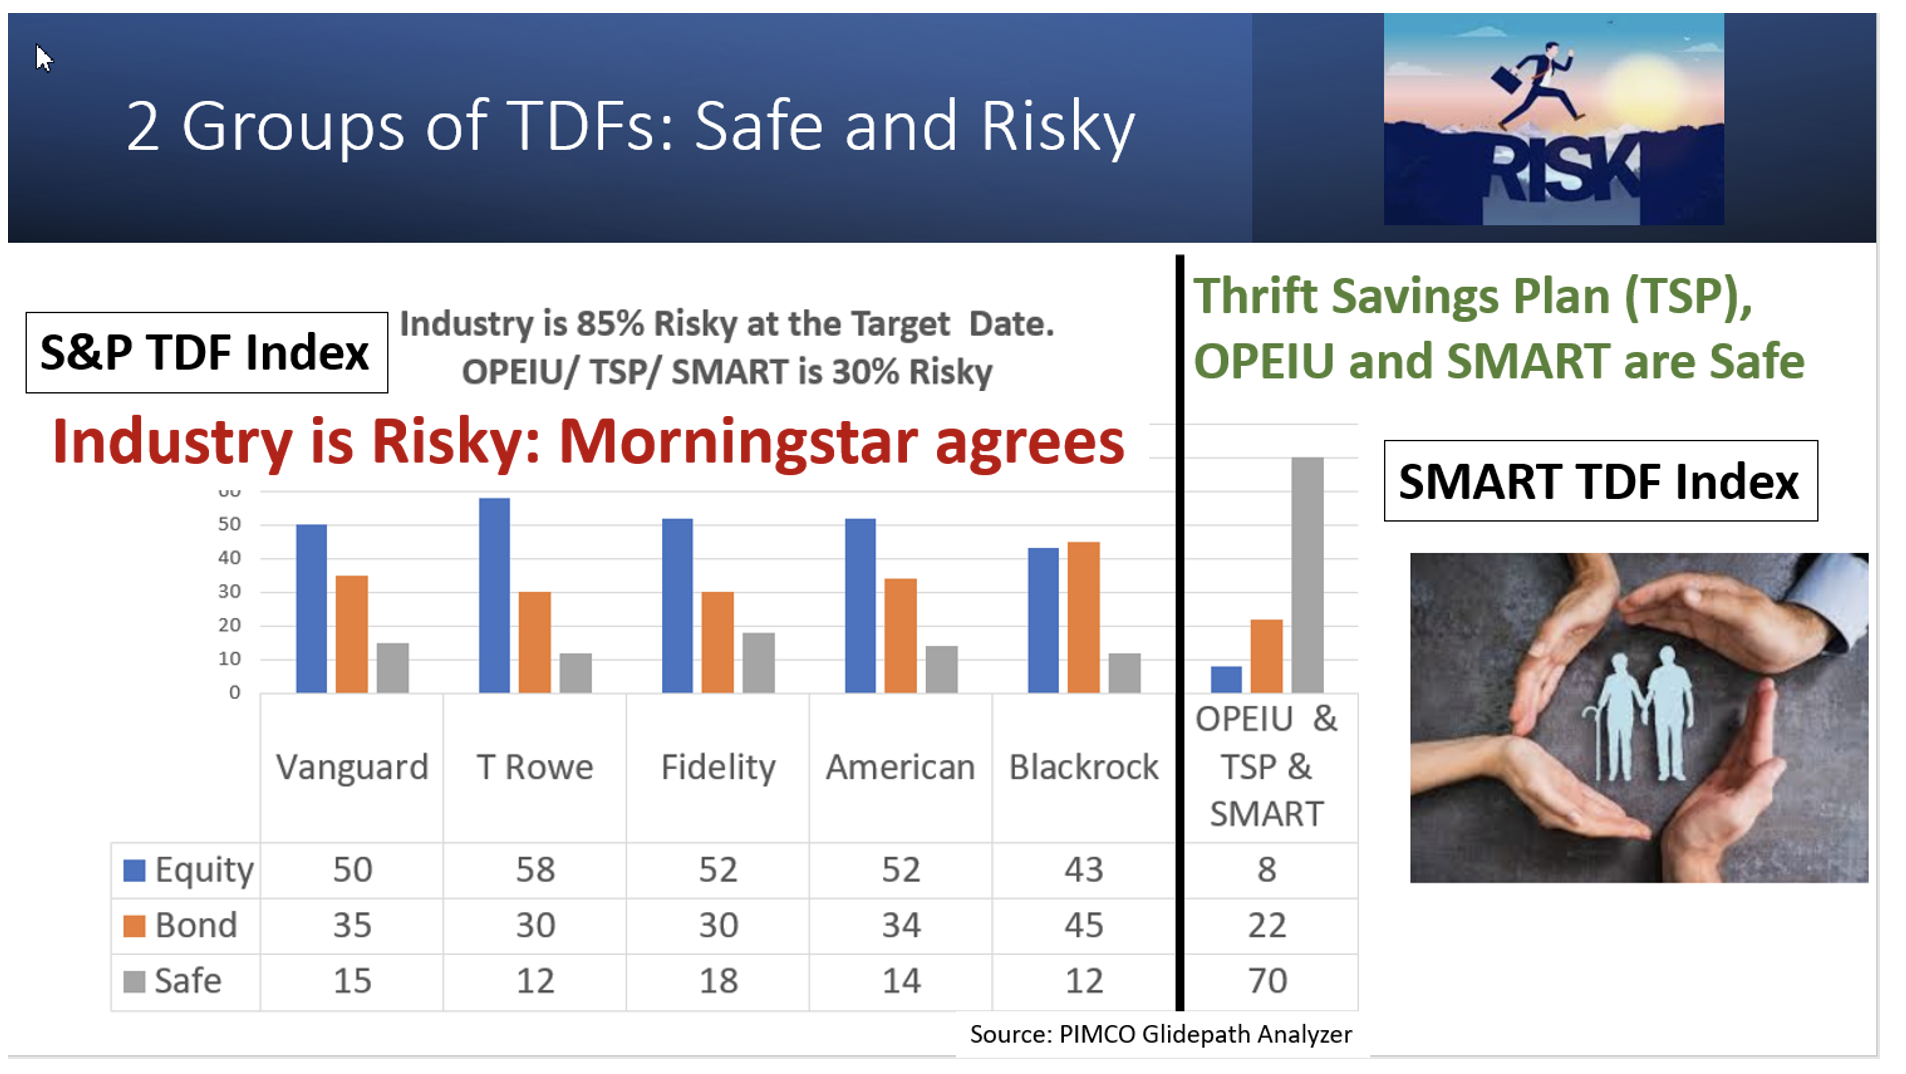
As you can see, the Safe group defends by holding less equities and by holding more in Safe assets, defined as T-bills or Stable Value, or in the case of TSP it’s Fund G, guaranteed against loss by the US government.
Performance contrasts
As shown in the following, The Safe group lost 3% in its 2020 fund in the past year, versus 11% for the Risky group. Also note that the Safe group’s 2020 fund lost much less than its 2060 fund , while the Risky group had similar losses for all vintages.
The revolution
There is a revolution beginning in TDFs that recognizes the importance of protecting beneficiaries as they near retirement. The inability of TDFs to provide this protection was revealed in 2008 when 2010 funds lost more than 30% but the stakes were low with only $200 billion in TDFs, so the lesson was forgotten.
Today there’s $3.5 trillion in TDFs and 78 million baby boomers in the Risk Zone when investment losses can ruin the remainder of life.
Conclusion
I am routinely pressed for an action step in my articles. If the SMART TDF Index were still available, I’d recommend it (I managed SMART), but it was closed last December because its performance lagged the Risky group. This underperformance was no surprise since high risk has won the performance horserace for the past decade. The other members of the Safe group are closed to outside investors.
So, unless SMART is re-opened (which I hope) or a new entry joins the Safe group, my advice for those near retirement in TDFs is to move out of the TDF and into safety until you leave the Risk Zone, which ends 5 years into retirement, at which time I advise gradually re-risking to extend the life of savings.
The views and opinions expressed herein are the views and opinions of the author and do not necessarily reflect those of Nasdaq, Inc.
