
A Data-Driven Intelligent Ticks Proposal
Our recent note discussed the merits of our new Intelligent Ticks Proposal.
One of the ways this proposal differs from tick limits set in other countries’ markets is to “let the market decide” what tick a stock should have, rather than setting the tick based on changes in a stock’s price and/or liquidity.
Today we explain how our industry group came to this idea, and why it works better for all stocks. In addition to Nasdaq participants, this working group included Enrico Cacciatore from Voya Investment Management, John Comerford from Credit Suisse, Chris Iacovella from the American Securities Association (ASA), Mehmet Kinak from T. Rowe Price, Justin Schack from Rosenblatt Securities and Eric Swanson from XTX Markets.
What MiFID does (and doesn’t) do well
Recall back when we first analyzed spreads and we suggested the MiFID model seemed to fit where spreads economically “maxed out” in the U.S. market too:
- More liquid stocks could support smaller returns for spread capture than less liquid stocks.
- As prices changed, the tick that was required to equal that return spread also had to change.
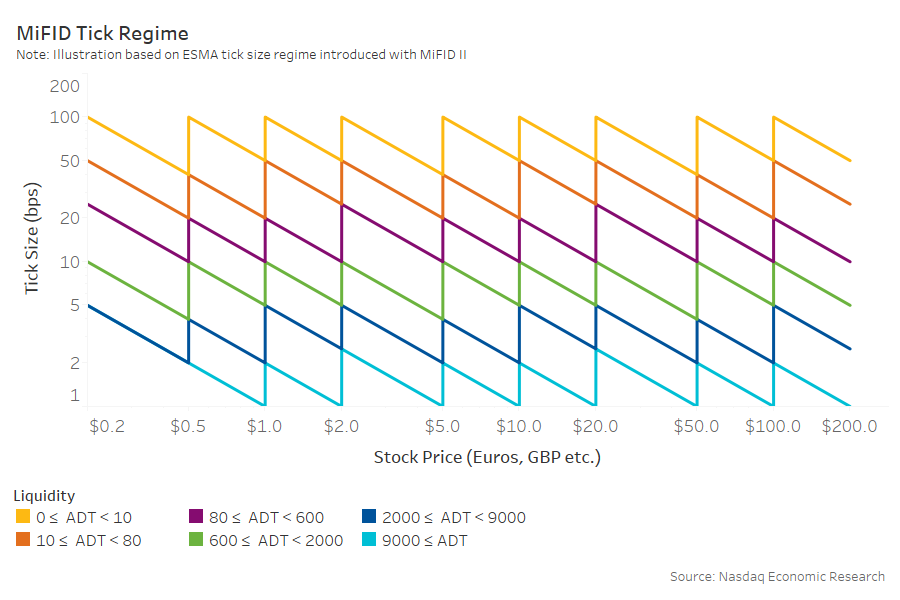
- The MiFID matrix of prices, liquidity and ticks creates spreads with a zig-zag pattern that forms a channel where the return for spread capture (in basis points) is roughly the same (Chart 1).
Chart 1: MiFID’s tick regime creates a “floor” (in basis points) for spreads that rises as liquidity falls
Applying a simplified MiFID in the U.S.
As our group of industry experts contemplated an intelligent tick regime, three important questions were raised:
- Can we make ours “simpler?”
- How would it actually work (what spreads would stocks be given)?
- Are any stocks “worse off?”
To answer the first question we created multiple grids like the one below that simplified the European matrix (Chart 2).
Chart 2: A simplified U.S. intelligent tick regime (in cents)
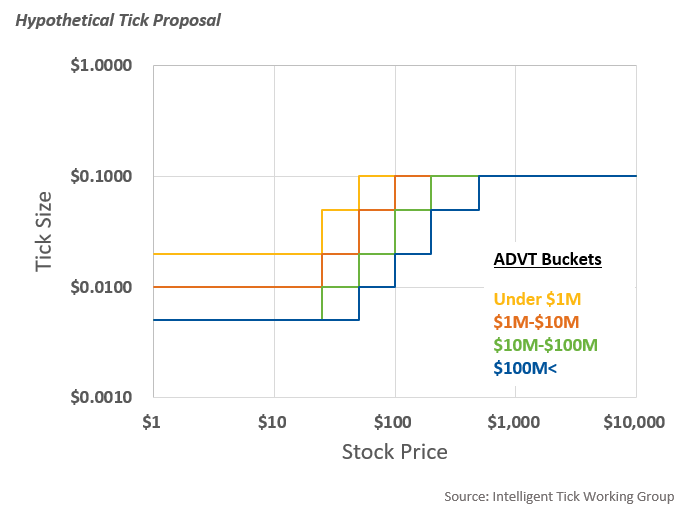
The data also indicated that notional trading was the measure of liquidity that best described how spreads changed, so we set the target minimum spreads for each group based on those results and ADVT buckets.
How does a MiFID regime work in the U.S.?
What happened when we looked at how U.S. stocks would trade in this regime, however, was interesting.
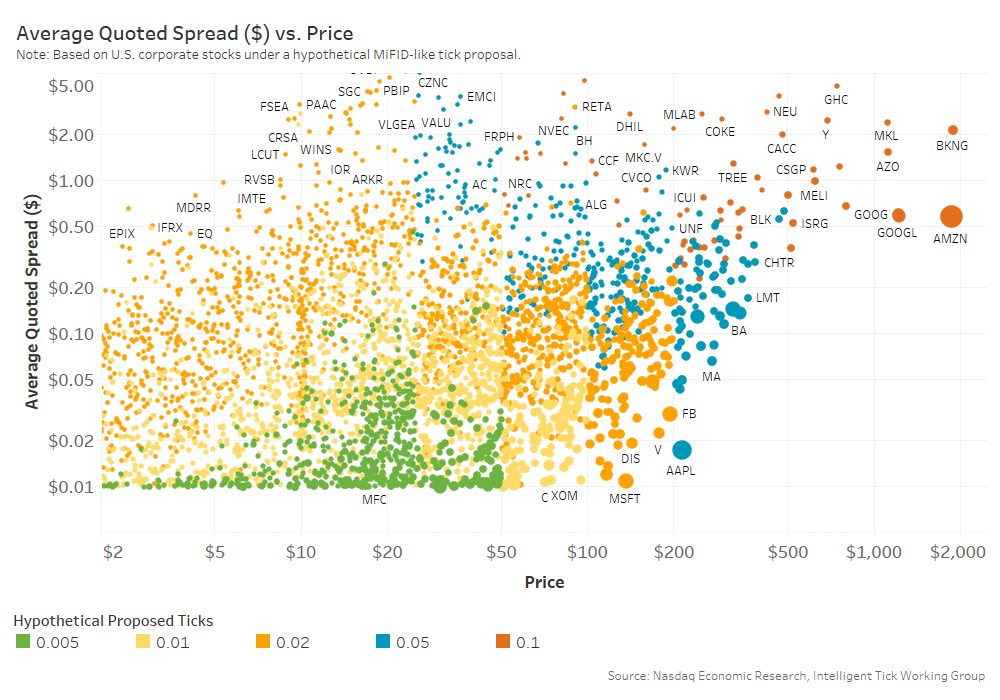
We show the data in Chart 3 for corporate stocks. Each circle represents a ticker, its height represents the spread it trades at now (in cents) and the horizontal axis shows how that changes as prices rise. The expected zig-zag shape is evident from the rough boundaries of colors (although they are downward sloping because this is in cents-per-share (cps) not basis points (bps)).
However, we found it hard to avoid doing harm to some stocks, giving them ticks wider than their spread now. Remember that data from the tick pilot showed that artificially widening spreads did most of the harm that led to the reported costs to investors. Often it was important stocks like AAPL, FB and JPM which currently trade around one-cent wide that would be put into two-cent or five-cent tick buckets because of their higher prices.
Chart 3: Corporate stocks in a simplified U.S. intelligent tick regime (spread in cents per share)
ETFs are the bigger problem
However these “outlier” problems got significantly worse when we applied the matrix to ETFs.
The majority of ETF liquidity currently trades with spreads around one-cent wide, even though the majority of ETF tickers are actually “thinly traded” ETFs. Because most thinly traded ETFs can be arbitraged cheaply, data show they also trade at relatively tight spreads too, especially when compared to stocks of comparable liquidity (ADVT).
That means that under the current tick regime:
- Liquid ETFs are often “tick constrained,” meaning the one-cent tick adds to costs and fragmentation.
- Illiquid ETFs are trade much better than comparably illiquid stocks. Consequently, the simplified tick structure will make those stocks “worse off” (see Chart 4).
Even worse, tickers like SPY would likely move to a wider two- or five-cent tick thanks to its high stock price, despite currently trading tick constrained at a one-cent tick. Conversely, there are many other tickers currently trading well inside a five-cent spread that would be allocated into five-cent (blue dots) or 10-cent (orange dots) buckets thanks to their low screen liquidity.
Chart 4: Many thinly traded ETFs would be harmed in a simplified MiFID-style intelligent tick regime
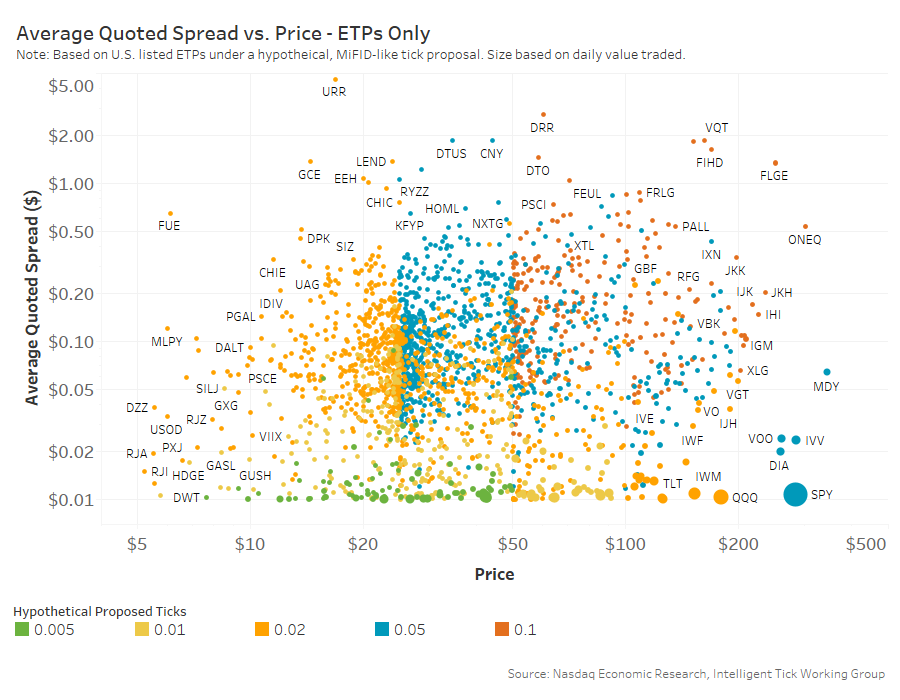
In fact, the results in Chart 4 show that more than one-in-10 ETF tickers would be harmed by being put into a tick group with a wider spread than they trade now.
Let the market decide
As the group realized that a price-based tick regime was almost certain to harm some tickers, we looked for an alternative.
The solution is designed to “make NO stocks worse off.” This solution borrows lessons learned from the tick pilot, which found that:
- Forcing spreads artificially wider adds to investors costs.
- Setting ticks closer to the level of wider spread stocks may actually reduce spreads, and should improve market quality metrics like quote stability and depth. The expectation is that a 14-cent stock will round down to a 10-cent spread when liquidity picks up and natural traders search for queue priority, narrowing the trade weighted spreads.
Importantly, this proposal could leverage the “tick group” structure used for the tick pilot, with tickers trading with different spreads depending what “group” (ticker list) they are added to.
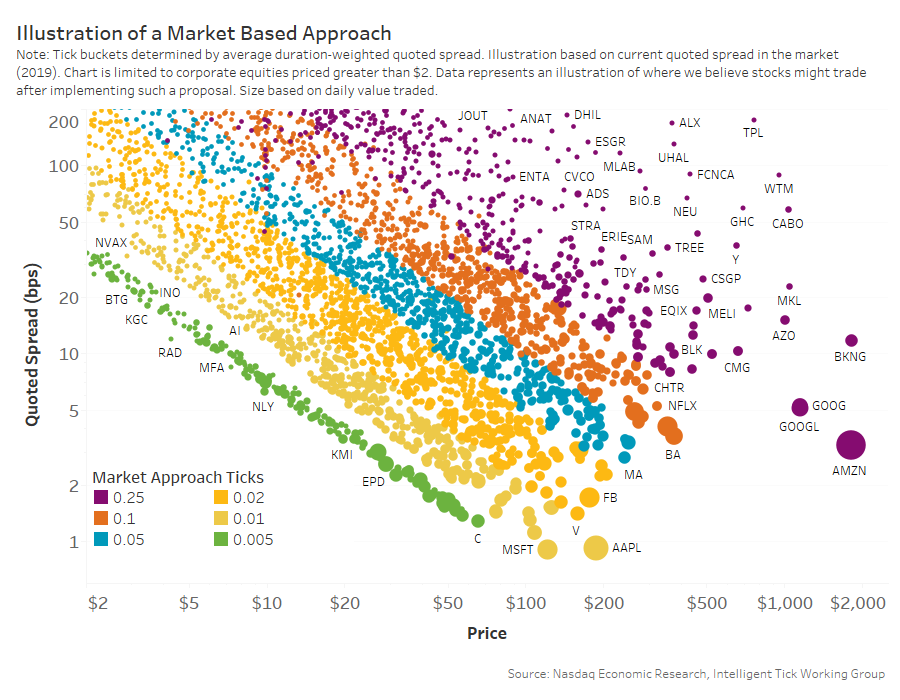
Chart 5: What the proposed ticks (colors) look like by stock price and current spread (in basis points), with half-cent spreads estimated using current average effective spreads
One benefit of this “market derived” structure is that tickers would be able to migrate (promote or demote) based on changes in their tradability, just as large-, mid- and small-cap indexes work today.
For example, the way we forecast what stocks should be promoted to the ½ cent bucket was to look for stocks with a time-weighted-average-spread of 1.1 cents or better. We then used the effective spreads to estimate likely spread improvements (green circles in Chart 5).
We could use the same 110% level for other buckets, although effective spreads (which account for mid-point fills) or trade weighted spreads (which put emphasis on times when the stock is active) may be an even better way to show stocks that can trade tighter. Although if ticks are too small, NBBO depth will fall. Traders in our working group intuitively felt a one-cent tick, and current NBBO depth, should be the “norm” and this approach fit their intuition better.
Implications for ETFs
We can also use the current spreads to estimate how many tickers would be in each tick group.
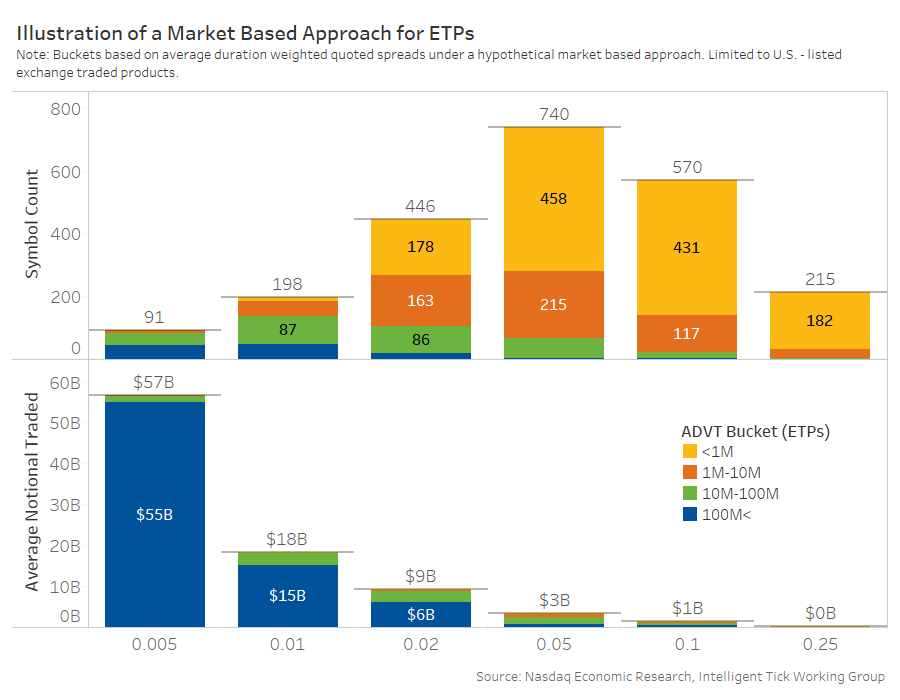
Importantly, under this proposal, around 64% of all ETF liquidity would trade in the ½ cent tick bucket. That alone should save investors and hedgers significantly.
However, more than half of the 2,200 ETFs fall into the two-cent bucket or higher, and more than one-third fall into the 10-cent or higher buckets. That sounds bad, but note that it reflects how those ETFs trade now. An issuer could still improve an ETF’s tick by improving the trading (effective spreads) so that their tickers qualify for promotion to narrower tick groups over time.
Chart 6: The majority of ETF liquidity would be moved to the ½ cent tick, even though that represents less than 100 ETF tickers
Market-wide savings of up to $1 billion?
Because these ticks make no spreads worse off, we expect trading spreads and costs to only fall.
Even before including ETFs, we estimated savings of around $1 billion using the following assumptions:
- Spreads compress from current levels 75% toward their optimal spread but can improve no more than the new tick.
- “Takers” are the only ones who benefit from tighter spreads.
- Takers cross the spread a net 20% of the time; consistent with how we found algos work .
- We compared new spread costs to crossing half the current NBBO spread (mid-spread).
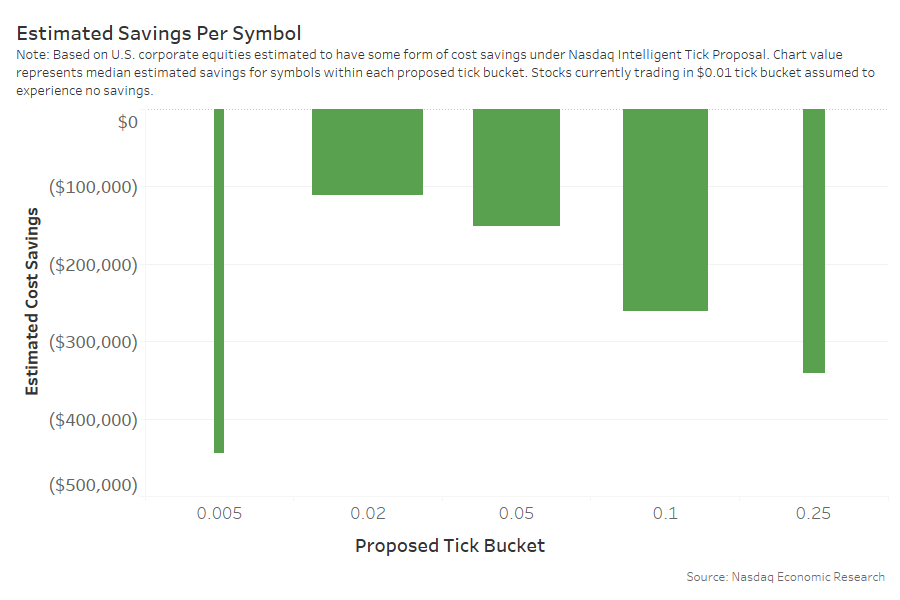
The data in Chart 7 shows that each tick constrained stock is likely to be significantly cheaper to trade (bar height) although because there are more stocks in the two- and five-cent buckets (bar width) a material amount of savings come from making their NBBO’s more competitive. Importantly, these stocks would also have shorter queues and less routing conflict, consistent with findings in the tick pilot analysis.
Chart 7: Estimated trading savings per corporate stock with bar-width showing count of symbols in each group (excludes ETFs)
Overall, the data supports this market-driven solution and the cost benefit seems compelling. Although different ticks sounds complex, by making spread economics more consistent (in basis points), queues and routing should be simplified and quotes more stable.
At least that’s what the data seem to show.
