The old adage that everything is bigger in Texas is true, considering the number of Lone Star State suburbs that are quickly growing in population and overall wealth.
See More: 25 Places To Buy a Home If You Want It To Gain Value
Learn More: How To Start Investing In Real Estate – Even If You’re Not Rich
To determine which American suburbs are among the wealthiest and fastest-growing, GOBankingRates sourced places from the U.S. Census American Community Survey with populations between 25,000 and 100,000. Metro areas with populations of 1 million or more were kept and the American Community Survey Census from 2018 and 2023 was referenced to determine each city’s numerical and percentage change in population from 2018 to 2023. Additional factors found for each location include median household income, average home value and livability score.

Key Findings
- The three fastest-growing wealthy American suburbs are all based in Texas. Ranked in order are Fulshear (No. 1 with a population increase of 237%), Celina (No. 2 at 190%) and Prosper (No. 3 at 81%).
- Texas is home to seven fast-growing wealthy suburbs, the most out of any state. They include Fulshear, Celina, Prosper, Flower Mound, Southlake, University Park and Colleyville.
- California boasts the second-highest number of growing wealthy suburbs. The Golden State’s five fastest-growing suburbs for wealth are Dublin, Eastvale, San Ramon, El Dorado Hills and North Tustin.
Take a look at America’s 30 fastest-growing wealthy suburbs.
Be Aware: 7 Housing Markets Where Home Values Could Plummet Next Year
Explore More: 20 Best Cities Where You Can Buy a House for Under $100K
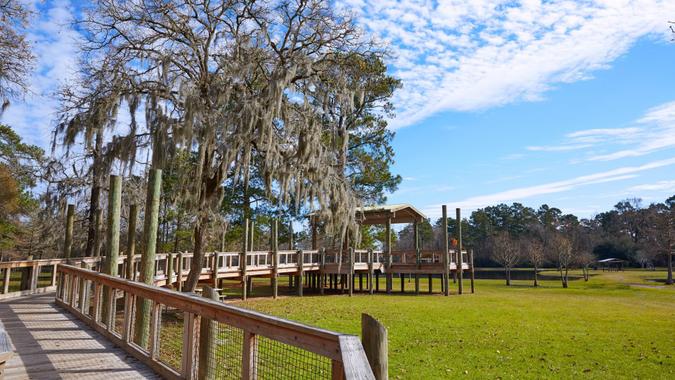
1. Fulshear, Texas
- Metro area: Houston
- Population change: +237%
- Median income: $178,398
- Average home value: $521,157
- Livability score: 71
Find Out: Renting vs. Owning a Home — Which Will Be Cheaper in 2025?

2. Celina, Texas
- Metro area: Dallas
- Population change: +190%
- Median income: $155,875
- Average home value: $611,512
- Livability score: 69
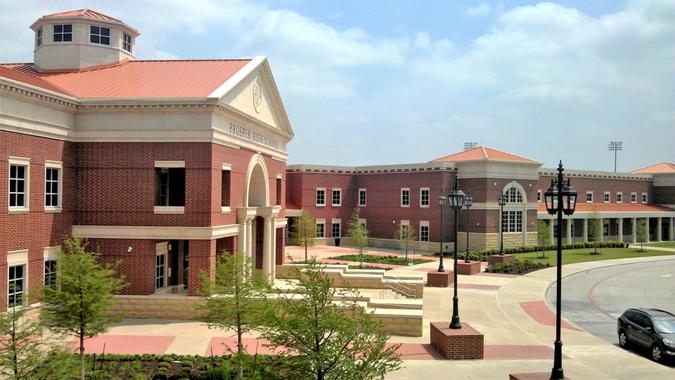
3. Prosper, Texas
- Metro area: Dallas
- Population change: +81%
- Median income: $187,603
- Average home value: $823,356
- Livability score: 70

4. Erie, Colorado
- Metro area: Denver
- Population change: +39%
- Median income: $163,644
- Average home value: $744,217
- Livability score: 76

5. Clarksburg, Maryland
- Metro area: Washington, D.C.
- Population change: +24%
- Median income: $178,641
- Average home value: $666,722
- Livability score: 64

6. Zionsville, Indiana
- Metro area: Indianapolis
- Population change: +20%
- Median income: $159,126
- Average home value: $614,241
- Livability score: 78
For You: 5 Affordable Small Cities To Live In on the West Coast
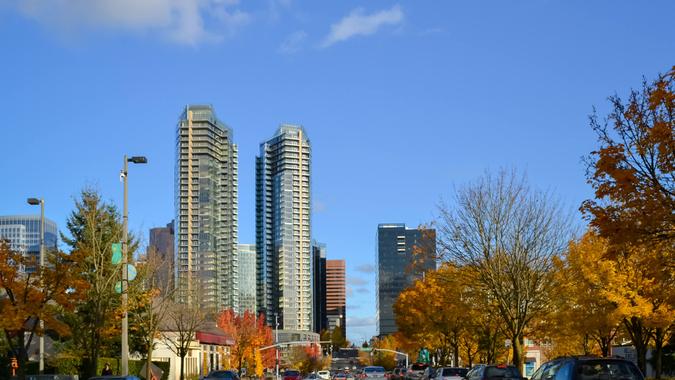
7. Redmond, Washington
- Metro area: Seattle
- Population change: +20%
- Median income: $162,099
- Average home value: $1,480,954
- Livability score: 88

8. Dublin, California
- Metro area: San Francisco
- Population change: +19%
- Median income: $205,046
- Average home value: $1,488,417
- Livability score: 85
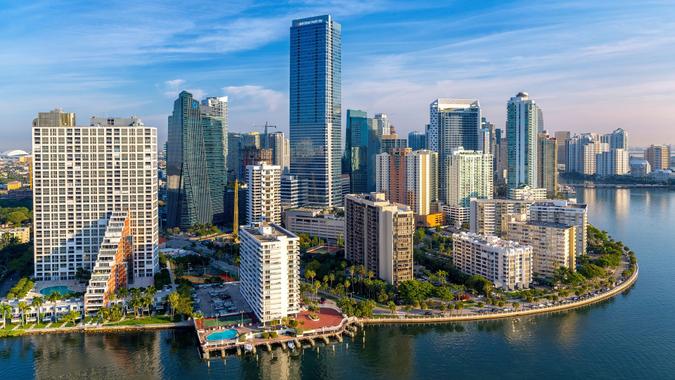
9. Parkland, Florida
- Metro area: Miami
- Population change: +17%
- Median income: $200,156
- Average home value: $1,065,313
- Livability score: 67
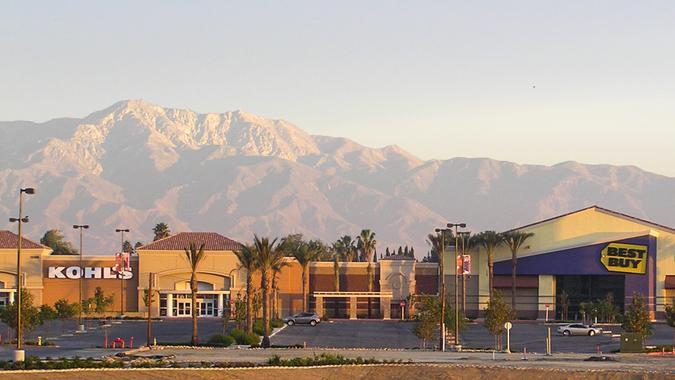
10. Eastvale, California
- Metro area: Riverside
- Population change: +14%
- Median income: $161,322
- Average home value: $948,164
- Livability score: 63
That’s Interesting: Is Leasing Really Cheaper? ChatGPT Crunches the Numbers for Buying vs. Leasing Over 12 Years

11. San Ramon, California
- Metro area: San Francisco
- Population change: +14%
- Median income: $197,358
- Average home value: $1,733,442
- Livability score: 87
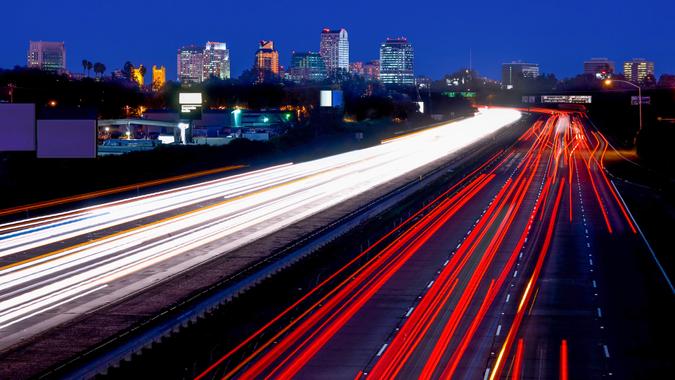
12. El Dorado Hills, California
- Metro area: Sacramento
- Population change: +11%
- Median income: $163,544
- Average home value: $908,158
- Livability score: 60

13. Bethesda, Maryland
- Metro area: Washington, D.C.
- Population change: +8%
- Median income: $191,348
- Average home value: $1,268,602
- Livability score: 79

14. Brentwood, Tennessee
- Metro area: Nashville
- Population change: +8%
- Median income: $184,720
- Average home value: $1,317,389
- Livability score: 72
Discover Next: 21 Affordable Small Cities To Retire on the East Coast

15. Dublin, Ohio
- Metro area: Columbus
- Population change: +8%
- Median income: $155,282
- Average home value: $592,343
- Livability score: 77

16. Issaquah, Washington
- Metro area: Seattle
- Population change: +7%
- Median income: $153,786
- Average home value: $1,290,389
- Livability score: 88
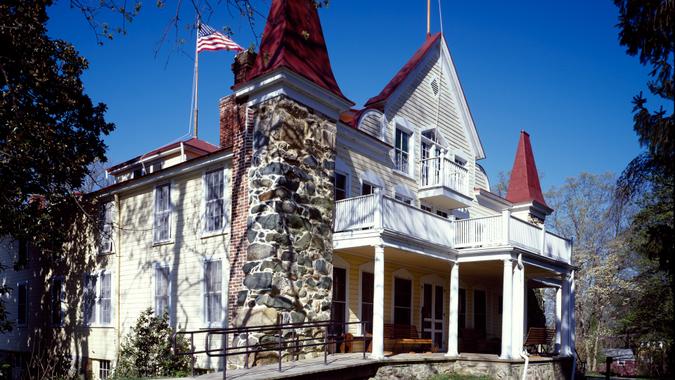
17. McLean, Virginia
- Metro area: Washington, D.C.
- Population change: +7%
- Median income: $250,000
- Average home value: $1,544,325
- Livability score: 81

18. East Honolulu, Hawaii
- Metro area: Urban Hololulu
- Population change: +7%
- Median income: $158,398
- Average home value: $1,300,013
- Livability score: 87
Trending Now: If Interest Rates Are Going Down, What Will Mortgage Rates Look Like in 2025?
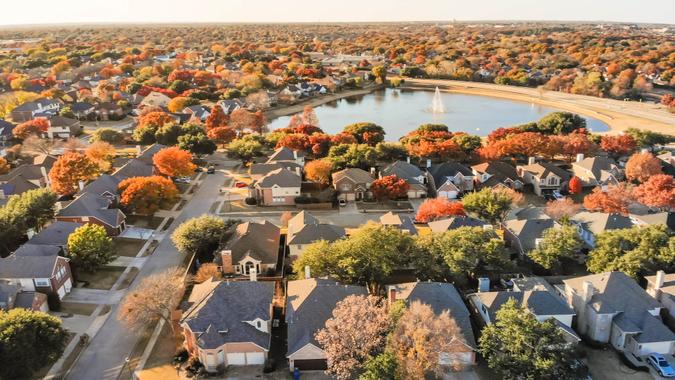
19. Flower Mound, Texas
- Metro area: Dallas
- Population change: +6%
- Median income: $157,737
- Average home value: $599,026
- Livability score: 71

20. North Tustin, California
- Metro area: Los Angeles
- Population change: +5%
- Median income: $186,250
- Average home value: $1,700,977
- Livability score: 62
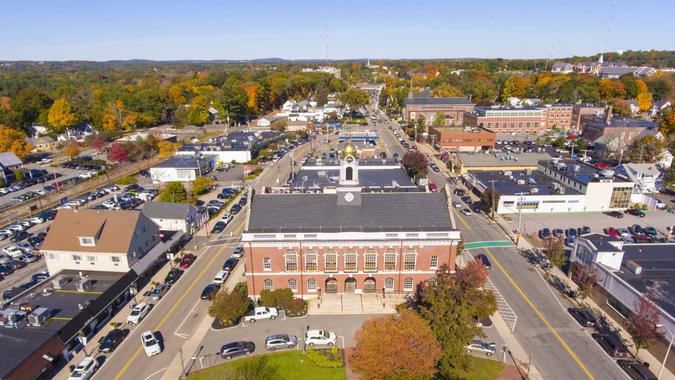
21. Needham, Massachusetts
- Metro area: Boston
- Population change: +4%
- Median income: $212,241
- Average home value: $1,491,734
- Livability score: 84

22. Milton, Massachusetts
- Metro area: Boston
- Population change: +3%
- Median income: $178,053
- Average home value: $1,022,751
- Livability score: 77
See Next: 5 Housing Markets That Will Plummet in Value Before the End of 2025
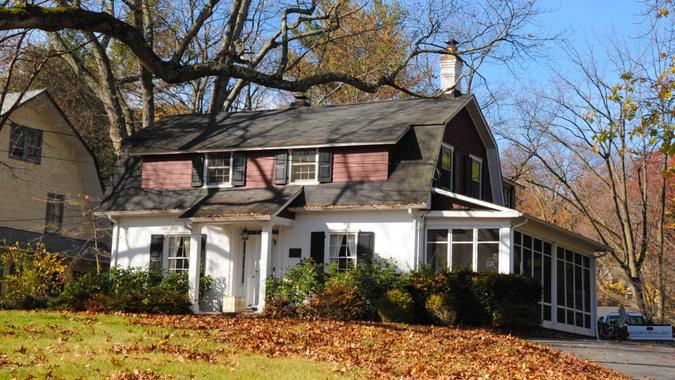
23. Ridgewood, New Jersey
- Metro area: New York, New York
- Population change: +3%
- Median income: $217,250
- Average home value: $1,090,056
- Livability score: 88
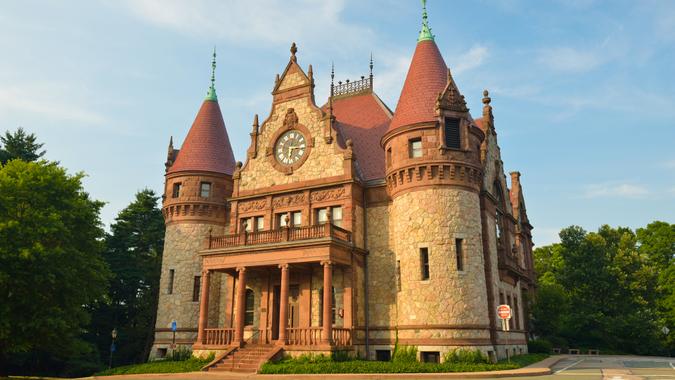
24. Wellesley, Massachusetts
- Metro area: Boston
- Population change: +2%
- Median income: $250,000
- Average home value: $1,956,950
- Livability score: 85
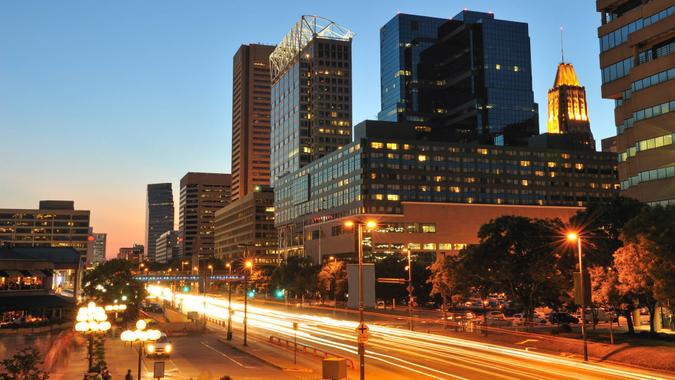
25. Severna Park, Maryland
- Metro area: Baltimore
- Population change: +2%
- Median income: $168,091
- Average home value: $708,100
- Livability score: 78
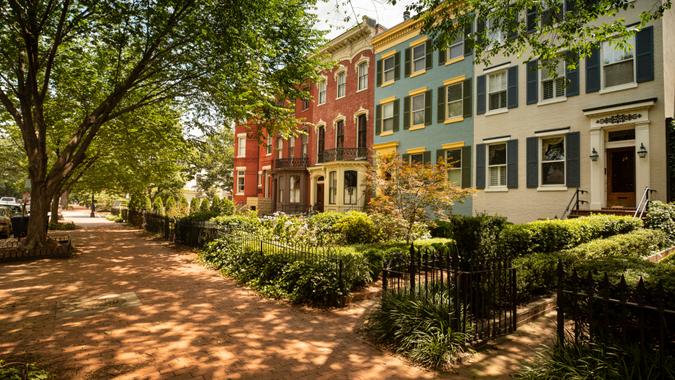
26. Olney, Maryland
- Metro area: Washington, D.C.
- Population change: +2%
- Median income: $171,766
- Average home value: $666,345
- Livability score: 81
Learn More: 10 Housing Markets Buyers Are Flocking To as Rates Drop

27. Southlake, Texas
- Metro area: Dallas
- Population change: 0.66%
- Median income: $250,000
- Average home value: $1,215,002
- Livability score: 76
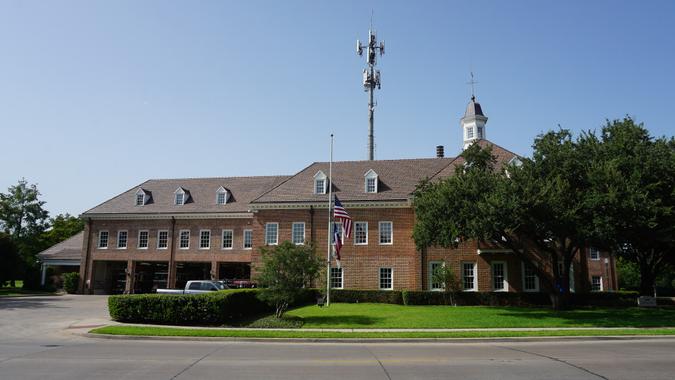
28. University Park, Texas
- Metro area: Dallas
- Population change: 0.60%
- Median income: $250,000
- Average home value: $2,334,151
- Livability score: 83

29. Colleyville, Texas
- Metro area: Dallas
- Population change: -0.50%
- Median income: $203,566
- Average home value: $886,166
- Livability score: 79

30. Oakton, Virginia
- Metro area: Washington, D.C.
- Population change: -1.10%
- Median income: $163,662
- Average home value: $1,120,836
- Livability score: 77
Editor’s note: Photos are for representational purposes only and might not reflect the exact locations listed.
Methodology: For this study, GOBankingRates analyzed suburbs to find the fastest-growing wealthy suburbs in America. First GOBankingRates found the places with a population between 25,000 and 100,000 according to the U.S. Census American Community Survey. The metro area for each location was found and only the metro areas with a population of 1 million or more were kept. With these suburbs isolated, the numerical and percentage change in population from 2018 to 2023 were found for each city using data from the American Community Survey Census from 2018 and 2023. For each location, GOBankingRates found total population, population ages 65 and over, total households, and household median income all sourced from the American Community Survey. Only places with a median household income of $150,000 or more were kept for this study. Using this data the percentage of the population ages 65 and over were calculated. The cost-of-living indexes were sourced from Sperling’s BestPlaces and include the grocery, healthcare, housing, utilities, transportation, and miscellaneous cost of living indexes. Using the cost-of-living indexes and the national average expenditure costs, as sourced from the Bureau of Labor Statistics Consumer Expenditure Survey, the average expenditure cost for each location were calculated. The livability index was sourced from AreaVibes for each location and included as supplemental information. The average single-family home value was sourced from Zillow Home Value Index for November 2024. Using the average single-family home value, assuming a 10% down payment, and using the most recent national average 30-year fixed mortgage rate, as sourced from the Federal Reserve Economic Data, the average mortgage can be calculated. Using the average mortgage and average expenditure costs, the average total monthly and annual cost of living were calculated. The cities were sorted to show the highest percentage population increase first to show the places with the fastest-growing wealthy suburbs in America. All data was collected on and is up to date as of Jan. 6, 2025.
More From GOBankingRates
- 4 Low-Risk Ways To Build Your Savings in 2025
- 5 2025 SUVs the Middle Class Should Consider Buying
- 25 Places To Buy a Home If You Want It To Gain Value
- 3 Things You Must Do When Your Savings Reach $50,000
This article originally appeared on GOBankingRates.com: 30 Fastest-Growing Wealthy Suburbs in America
The views and opinions expressed herein are the views and opinions of the author and do not necessarily reflect those of Nasdaq, Inc.


