
2021 Year in Review: Swelling the Ranks of the Nasdaq Biotechnology Index™
The Nasdaq Biotechnology Index (NBI™) was launched on Nov. 1, 1993, when the biotech industry was still in its relative infancy and prone to heightened volatility. Ten years later, the index tracked only 75 companies and was in the midst of a lost decade of negative returns along with much of the traditional Technology sector. Another ten years later, its constituent count had increased to 118, and the index was back to outperforming the broader U.S. equity market.
In the age of Covid, NBI’s constituent basket has swelled to 373 companies as of Dec. 20, 2021, when the most recent annual reconstitution went effective. A record total of 129 new components just qualified for index inclusion, following 100 such additions in December 2020. Tremendous growth has taken place within the small-cap biotech space over the past two years, the overwhelming majority of which has stemmed from IPOs on the Nasdaq Stock Exchange. Let’s examine how recent additions to the index have impacted returns and changed the overall risk profile while considering the implications for investors seeking a suitable industry benchmark.
December 2021 Reconstitution Overview

Over the past 10 calendar years, 2020 and 2021 stand apart from the rest in terms of index additions and net change in the constituent base of NBI. 2020 and 2021 saw a net increase in the number of components by 64 and 91, respectively, vs. an average of 12.25 over the preceding eight years. The swelling in the ranks was driven by the “plus” column, as the volume of deletions in both years (36 and 38) was fairly typical of the past decade.
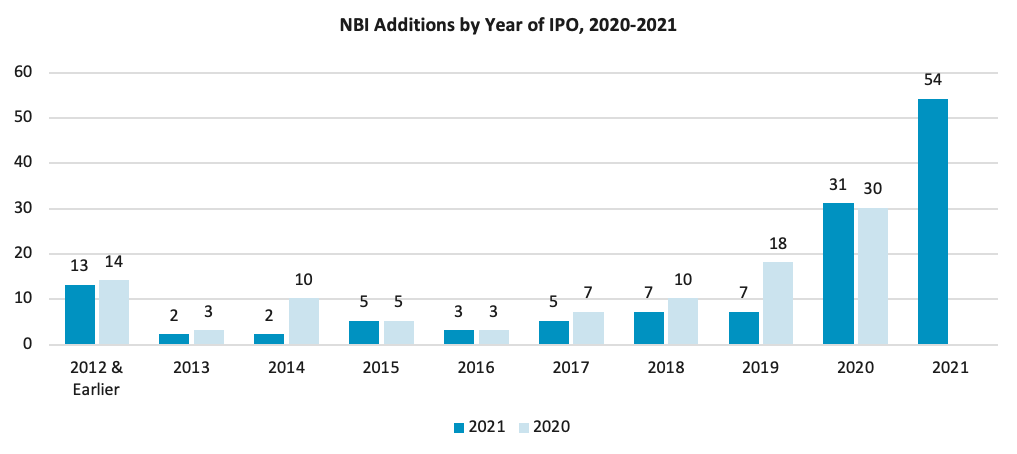
In terms of IPO vintage years, 2021’s reconstitution accelerated the trend set in 2020, with most additions stemming from recent IPOs: 54 of the 129 went public in 2021, with another 31 in 2020, while the remaining 44 listed in 2019 or earlier. This followed 30 same-year IPO additions in 2020 vs. 18 in 2019 and 52 from years prior. In total, 128 biotech companies went public in the U.S. in 2021, vs. 99 in 2020 and 56 in 2019. The biotech industry has clearly benefitted from robust trends in the IPO market across multiple sectors in the U.S. and globally. As the long-running home to biotech, Nasdaq has won more than 98% of these listings over the past three years and has a 97% win rate since 2013.
Following the most recent reconstitution, the Nasdaq Biotechnology Index is even more representative of the industry, bolstering its reputation as perhaps the most effective benchmark solution. Its constituent count is approximately double that of the S&P Biotechnology Select Industry Index (SPSIBI), despite limiting index membership to Nasdaq-listed companies. On the other hand, the decision not to limit membership by a company’s country of domicile has allowed the non-US-based subset of the index to grow to 57 members, representing 16% of the aggregate index weight as of Dec. 20, 2021.
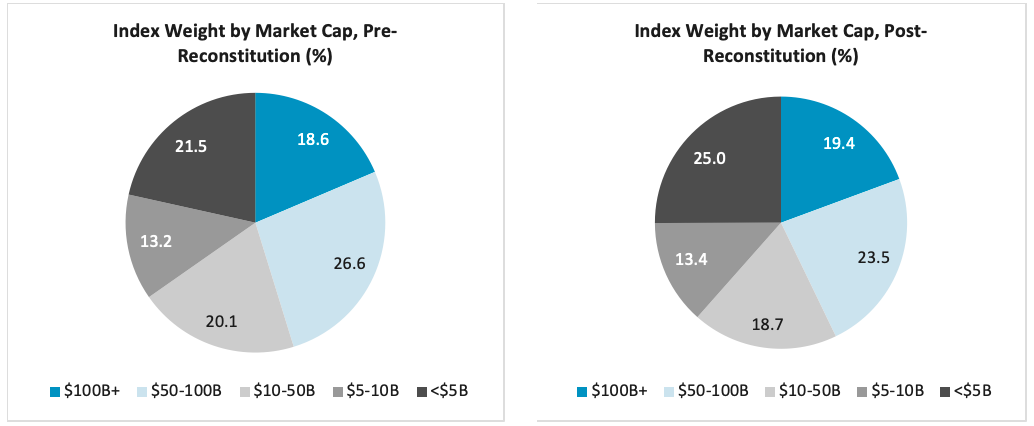
Overall, the NBI Index has evolved into a younger, more diversified portfolio of companies while still preserving the importance of the largest biotech players. Although the average market capitalization of constituents dropped noticeably – from $5.9B to $4.5B (23% smaller) immediately following the reconstitution – the weighted average market cap stayed nearly constant, decreasing from $48.3B to $47.3B (2% smaller). The top 10 largest constituents continue to represent nearly half of the index weight, dropping from 50.4% pre-reconstitution to 46.8% immediately after. At a high level, the index is more weighted towards small- and mid-cap companies than it used to be, but not materially so.
Performance Analysis
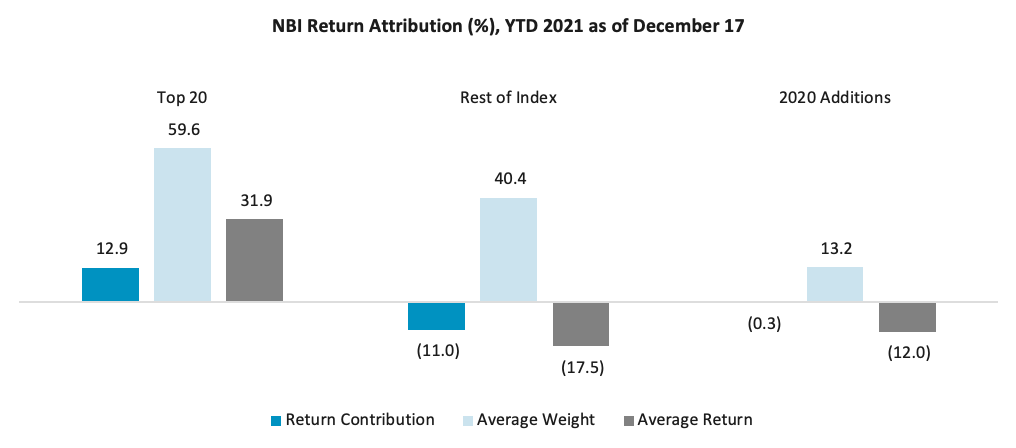
As far as price performance, NBI has been a relative underperformer in 2021, up only 1.9% YTD as of Dec. 17, 2021 (right before the annual reconstitution went effective). Splitting out the return contributions of each constituent and sorting by average index weight over the course of the year illustrates the stark dichotomy in performance within the sector. The top 20 largest constituents in NBI throughout 2021 – with an average aggregate weight of nearly 60% – contributed a net positive return of 12.9%, whereas the rest of the index generated a net negative return contribution of -11.0%. In terms of simple average return between these two groups, the difference in performance was even more dramatic, with an average return of 31.9% for the top 20 vs. -17.5% for the rest of the index. And regarding constituents that were added in December 2020, their performance wasn’t great, either – an average loss of 12% – but this group represented only 13.2% of the index weight on average throughout the year and thus contributed a negligible amount to the overall index return.
Simply put, 2021 was not a good year for small-cap biotech, and weakness was felt across recent IPOs and older companies alike. Thanks to NBI’s modified market-cap weighting approach, the pain in small-caps was mostly offset by strength in larger biotech companies. In contrast, the modified equal-weighted S&P Biotechnology Select Industry Index (SPSIBI) registered a strongly negative 2021 YTD return of -17.6% (as of Dec. 17), driven in large part by its overweighting of small-cap constituents.
Summary
The trend towards higher IPO volumes established during the Covid-19 pandemic may very well continue into 2022. The Nasdaq Biotechnology Index offers investors a transparent, effective benchmark for tracking new entrants into the public markets while maintaining appropriate weightings among the more volatile, younger small-cap segment of the industry and its more stable, older large-cap members.
ETFs currently tracking NBI include the Invesco Nasdaq Biotechnology ETF (Nasdaq: IBBQ), ProShares Ultra Nasdaq Biotechnology ETF (Nasdaq: BIB), ProShares UltraShort Nasdaq Biotechnology ETF (Nasdaq: BIS), Invesco Nasdaq Biotech UCITS ETF (London: SBIO), iShares Nasdaq U.S. Biotechnology UCITS ETF (London: BTEC), Capital Nasdaq Biotechnology Index ETF (Taiwan: 00678), and Mirae Asset TIGER Nasdaq BIO ETF (Korea: 203780).
Sources: Nasdaq Global Indexes, FactSet, Bloomberg.
Nasdaq® is a registered trademark of Nasdaq, Inc. The information contained above is provided for informational and educational purposes only, and nothing contained herein should be construed as investment advice, either on behalf of a particular security or an overall investment strategy. Neither Nasdaq, Inc. nor any of its affiliates makes any recommendation to buy or sell any security or any representation about the financial condition of any company. Statements regarding Nasdaq-listed companies or Nasdaq proprietary indexes are not guarantees of future performance. Actual results may differ materially from those expressed or implied. Past performance is not indicative of future results. Investors should undertake their own due diligence and carefully evaluate companies before investing. ADVICE FROM A SECURITIES PROFESSIONAL IS STRONGLY ADVISED.
© 2021. Nasdaq, Inc. All Rights Reserved.

Nasdaq Biotechnology Index
With disruption in our DNA, we are home to today’s top and emerging biotech companies, helping them pioneer a better tomorrow.

Contact Us for More Information
Global Indexes

Nasdaq Index Research Team
Nasdaq
Nasdaq calculates more than 40,000 diverse indexes, providing coverage across asset classes, countries and sectors.
Read Nasdaq Index Research Team's Bio