
2021 Review and Outlook for 2022
Executive Summary
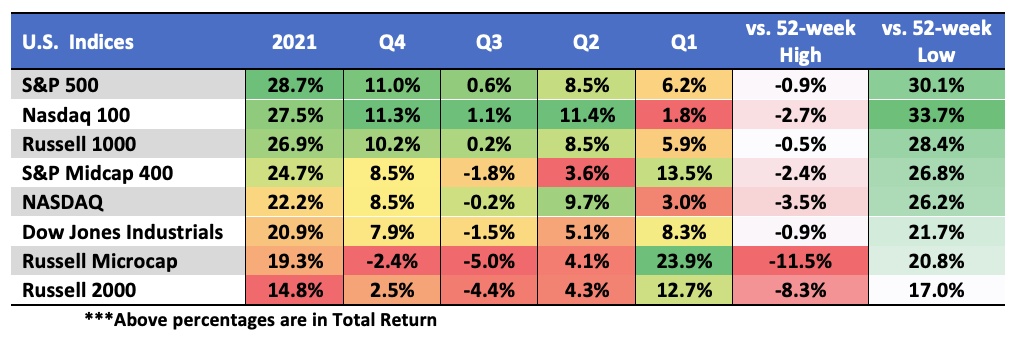
- U.S. Equity benchmarks posted strong gains for 3rd consecutive year
- All 11 sectors had double-digit returns for the first time on record (2001)
- Growth outperformed Value for a record 5th consecutive year
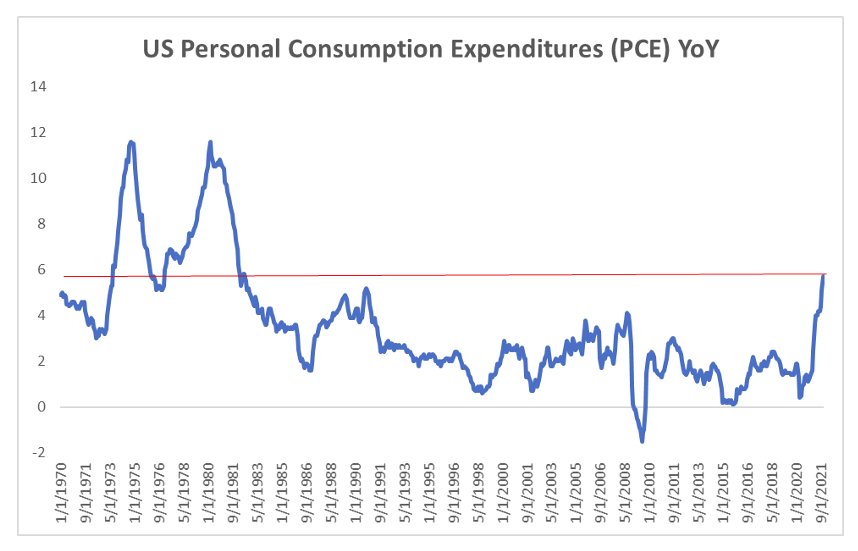
- Inflation measures are at 40-year highs
- Bloomberg Commodity Index highest gain in 42 years
- The Fed commenced tapering, and near three rate hikes are expected in 2022
It was another strong year for the U.S. stock market driven largely by strong economic activity, robust corporate earnings, and historic fiscal and monetary stimulus.
The rebound off the 2020 pandemic lows continued amidst a backdrop of headwinds headlined by virus variants, soaring inflation, a China slowdown, and a recent hawkish pivot by the Fed.
On a total-return basis, the S&P 500 led with a gain of 28.7%, the Nasdaq 100 +27.5%, the S&P Midcap 400 +24.7%, the Nasdaq Composite +22.2%, the Dow Jones Industrial Average +20.9%, and the Russell 2000 +14.8%. Since the 2009 lows, 2021 was only the second of 13 years in which the S&P 500 outperformed the Nasdaq 100. However, the NDX held up relatively well in 2021, considering it outperformed the SPX by more than 31 percentage points in 2020.
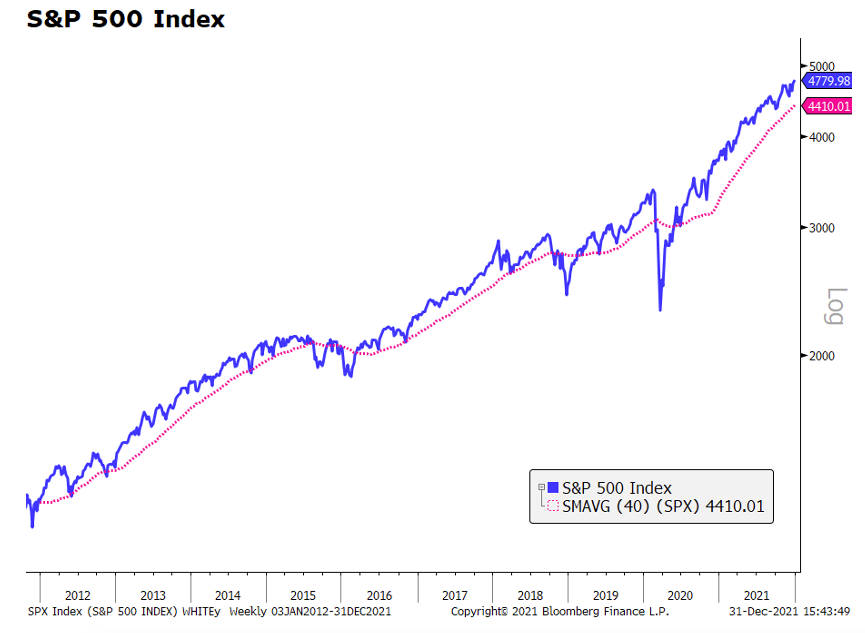
The S&P has now finished higher in 12 of the last 13 years. More recently, over the last three years, it has had a total return of 100%. This represents the 6th best 3-YR return on record since 1950. When ranking the top 35 “3-year cumulative returns” since 1950, the following 12-months are higher 83% of the time for an average gain of 15%. When the SPX is higher, the forward 12-month average gain is 20%! When lower, the forward 12-month average decline is only 6%, with the biggest drawdown being 11%. The biggest gains are 52%, 33%, 32%, 32%, 31%, 30%, 30%, and 29%!
While the Russell 2000 was the laggard performer in 2021 with a total return of “only” 15%, the small-cap benchmark owns the strongest gains off the pandemic lows. From the March 2020 lows to its recent high made in November 2021, the Russell 2000 gained 155%. For comparison, the Nasdaq 100 and Nasdaq Composite had rebounds of 148% and 145%, respectively, while the large-cap S&P 500 and Dow Jones gained 119% and 104%, respectively.
Most of the Russell 2000’s gains occurred within the first 12-months off the pandemic lows. By Q1’21, it rebounded 145%. During this run, there is a noteworthy 12-week period that stands out from both a historic and technical perspective. Over a short 12-week period from the start of November 2020 into January 2021, the Russell 2000 gained 41%. This is its 3rd highest 12-week performance since its inception in 1978.
The top two 12-week runs took place in 1982 (+43%) and 2009 (+43%). The 43% gain over 12-weeks in 1982 started one week after the index bottomed following a 30% decline. The 43% gain in 2009 started at the very bottom after a 60% decline during the Financial Crisis. Essentially the two record 12-week, 43% performances are measuring the very initial rebound following steep declines/crashes. However, the 41% gain in 2020/2021 started 32 weeks after the index bottomed, over which time the Russell had already gained as much as 71%.
A concern is that strong percentage moves over short periods of time take place on relatively low volume, which in turn makes them weak support ranges. This can be measured by the “volume at price” bars on the left y-axis of the below weekly period chart of the Russell 2000 ETF (ticker IWM). This was not an issue in 1982 and 2009 as price never retraced back into the price range spanning their respective 43% gains. Those moves started at the very beginning of major lows, which continued higher and never looked back. All future retracements/corrections/crashes took place at higher levels. The weak support range today is 20% wide. If price breaks below the key ~$210 support level at some point in the future, down 6% from its December close, it could be accompanied by high volatility and “gappy” price action, more than what many would otherwise expect.

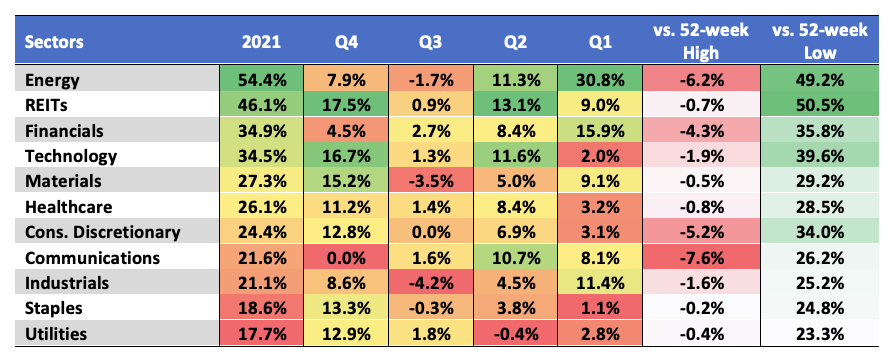
All eleven sectors posted double-digit returns led by Energy (+54.4%), REITs (46.1%), Financials (+34.9%), and Technology (+34.5%). Energy and Financials were the only two sectors in the red for 2020. According to data compiled by Bloomberg going back to 2001, this is the first time all eleven sectors posted double-digit gains.
Energy benefited from soaring oil and gas prices on strong demand and limited supplies. The 50-million-barrel release from the SPR had little impact given the 22 million barrels per day consumed in the U.S. High-yielding REITs benefitted from low rates and surging demand for warehouse space and rental properties.
Financials surged early in 2021 as long yields ran higher and regulators lifted guards on capital returns, first with buybacks in December 2020 and dividends announced with June CCAR results. Larger financials with greater exposure to capital markets benefitted from record M&A and IPO activity. Global M&A volumes exceeded $5 trillion for the first time ever in 2021, easily exceeding the prior record of $4.4 trillion from 2007. US deal volumes nearly doubled to $2.6 trillion, and private equity activity also set a record at nearly $1 trillion. Meanwhile, there were a record 1,032 U.S. IPOs (59% SPACs), which is a five-fold increase over the yearly average from the prior decade (2010 – 2019).
Inflation reared its head in 2021. The Covid-19 pandemic and following policy responses have had a profound economic impact on demand, supply, and labor, which combined have unleashed a wave of inflation, unlike anything central bankers have been able to achieve for decades. Last year’s economic shutdown damaged supply chains across numerous industries while also shifting consumer demand more towards goods and away from services. $6.6T in fiscal spending fueled demand, as the Fed provided liquidity and unlimited support via numerous programs, including ZIRP and QE.
The November consumer price index (CPI) and personal consumption expenditure (PCE) readings reached 6.8% and 5.7%, respectively, their highest pace in 40 years. November’s producer price index (PPI) came in at 9.8%.
As a result, disposable personal income fell for the fourth straight month, while the savings rate declined to its lowest since December 2017.
The Bloomberg Commodity Index (BCOM) gained more than 27% in 2021, its strongest annual gain in 42 years (1979)! WTI crude and gasoline rose 55% and 58%, respectively. Other standouts include coffee +76%, lumber +59%, heating oil 57%, natural gas +47%, cotton +44%, aluminum +42%, copper +27%, corn +23%, and wheat +20%. Precious metals were the outlier, with gold and silver declining 4% and 12%, respectively.
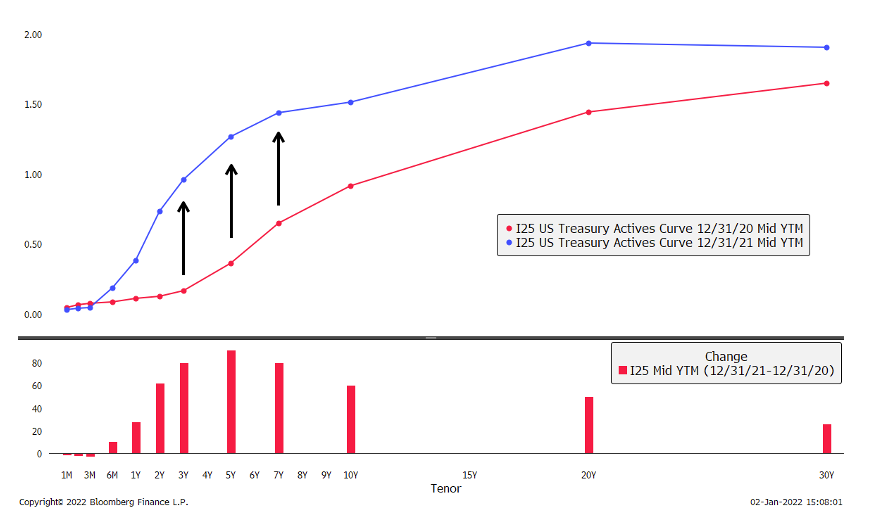
At the Nov. 3 FOMC, the Fed officially implemented a “hawkish pivot” when it announced it will start tapering its asset purchase program by $15B per month. At its next FOMC on December 15th, the Fed raised tapering to $30B per month, which puts an end to the repurchase program by this coming March. Between those two meetings, Chair Jerome Power officially “retired” the term transitory in describing the current inflation outlook. Futures are pricing in close to three rate hikes for 2022. There has been concern the Fed waited too long before its hawkish pivot and could be forced to pump the brakes if inflation doesn’t soon peak.
The below chart plots the Treasury Yield Curve at year-end 2020 (red) and year-end 2021 (blue), with the net change in the lower panel. The biggest rise took place in the belly of the curve (2’s, 3’s, 5’s, 7’s), reflecting expectations for “liftoff” in mid-2022.
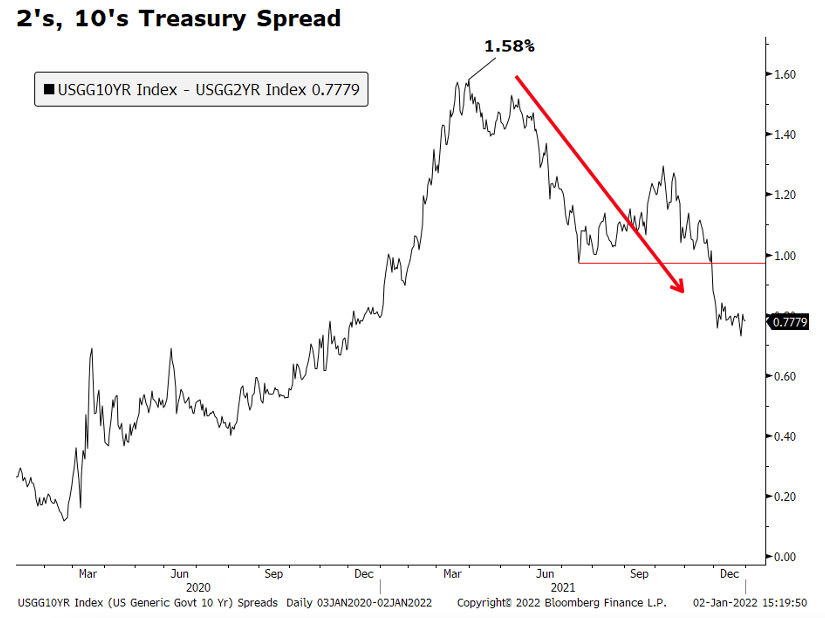
Treasury spreads peaked in Q1 before flattening throughout the remainder of 2021. The 2’s / 10’s Treasury spread peaked at 1.58% in March and closed the year at 78bps. While a flatter curve is in part reflecting slowing growth, the curve is far from inverted.
While economic growth is slowing, most are looking for U.S. equity markets to continue higher in 2022. However, underneath the hood of the benchmarks, we could see changes in leadership. One broad area to look to is Growth vs. Value. In 2021, the Russell 1000 Growth Index (+27.6% total return) outperformed the Russell 1000 Value Index (+25.1%) by 2.5 percentage points. This is the 5th consecutive year Growth has outperformed Value.
Before the Covid pandemic, the longest streak of Growth outperformance since the inception of the Russell indices (1978) has been three years. In the 1990’s dot-com era (1989 – 2000), only once did Growth outperform Value for three straight years (1989 – 1991). From 1989 through 1999, Growth outperformed Value by a combined 337 percentage points, or an average of 6.5% annually. The pendulum then swung the other way whereby Value outperformed Growth for seven consecutive years (2000 – 2006) by a combined 99 percentage points, or an average of 11.8% annually.
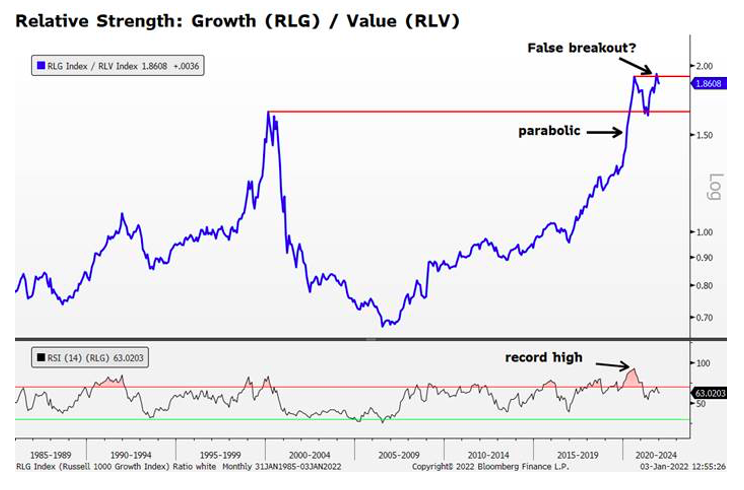
The current streak of outperformance by Growth over Value is nothing short of remarkable. Based on monthly closing prices, the ratio of the Growth Index over the Value Index (chart below) bottomed in July 2006. From there, it trended higher for more than 14 years before peaking in August 2020. Coincidentally, over this period, Growth outperformed Value by 337 percentage points.
The most extreme rate of outperformance over this time occurred over the first eight months of 2020, where Growth outperformed Value by an average of 4.5 percentage points each month! In the below chart, the ratio goes parabolic higher like a wall while knifing through the 2000 highs. This resulted in the monthly RSI (a measure of momentum) reaching an extreme all-time high reading of 93, as the ratio itself made a new all-time. The ensuing pullback bottomed at the prior high from 2000 (common technical price action; prior resistance turns into support), before then resuming higher. Recently in November, the ratio made a modest new high; however, its momentum was much weaker (bearish divergence), and the ratio has pulled back.
Given the long 14-year trend of Growth’s outperformance versus Value, it is too early to put a stake in the ground and declare a changing of the guard is underway. Big ships take a long time to turn. However, the technicals clearly show Growth’s outperformance reached extreme, record overbought levels. One could certainly make a credible case, based on technicals, that Value’s day in the sun is long overdue. The November breakout to new highs has the potential to be what technicians refer to as a “false breakout,” which often can be followed by sharp countertrend moves to the downside. In this case, that would suggest Value is in the early stages of taking over the leadership position.
Looking Ahead
It is said all bull markets climb their own wall of worry, and the present times are no different, to say the least. A $1.75 trillion “Build Back Better” fiscal spending package could pass in early 2022; however, a fiscal cliff is inevitable thereafter. Inflation is at 40-year highs despite wage growth not being a major contributor, but some argue it is close to peaking. The Federal Reserve is now tapering, and “liftoff” is expected to commence in Q2. Markets will be reading the economic tea leaves in anticipating the pace of those hikes. Covid risk remains front and center. Pandemic concerns rose in late November with the onset of the Omicron strain. So far, it is showing far greater transmission levels but milder symptoms, as evidenced by daily cases, hospitalizations, and death rates. By late December, new cases surged to record highs, more than doubling the prior highs from January ’21.
Stocks moving to record highs in the final week of 2021 suggest that investors do not expect significant shutdowns. And corporate earnings were strong in 2021. Record margins reflect management’s ability to manage inflationary pressures with price increases. The likelihood, therefore, is that these trends can continue and support stock prices. Most bad years for stocks are preceded by weak years. As we saw above, three strong years of S&P 500 performance does not necessarily mean a decline will follow. History suggests the path of least resistance is higher.
The information contained herein is provided for informational and educational purposes only, and nothing contained herein should be construed as investment advice, either on behalf of a particular security or an overall investment strategy. All information contained herein is obtained by Nasdaq from sources believed by Nasdaq to be accurate and reliable. However, all information is provided “as is” without warranty of any kind. ADVICE FROM A SECURITIES PROFESSIONAL IS STRONGLY ADVISED.
The views and opinions expressed herein are the views and opinions of the author and do not necessarily reflect those of Nasdaq, Inc.
Other Topics
Stocks Coronavirus
The Market Intelligence Desk Team
Nasdaq
Nasdaq’s Market Intelligence Desk (MID) is designed to provide critical touch-points for timely trading analysis and market information.