2020 Review and Outlook for 2021
2020 was a year for the ages, starting early in Q1 when the coronavirus pandemic spread globally and quickly became the largest global health crisis since the Spanish flu in 1918. The global “virus policy response” was initially staggered, but eventually, most of the world adhered to a strategy of containment, social distancing, and economic stoppage with the essential goal of flattening the virus curve. The resulting economic impact was profound. The global economy went into a tailspin as many countries closed their borders. Companies and schools closed their doors, resulting in millions of Americans working and studying remotely from home. Many businesses closed permanently, driving the US unemployment rate to generational extremes to 14.7% from 3.5% in just two months’ time. Weekly unemployment claims spiked from 282,000 to 6.9M in two weeks. In Q2, U.S. GDP suffered its largest annualized decline on record (-31.4%). The capital markets experienced historic price swings on par with any era since the early 1900s.
In March, the Dow Jones Industrials declined 38% from all-time highs for its top 3 largest drawdowns (MoM) since the start of the 20th century. Trading volumes surged to record levels, and numerous market-wide circuit breakers were triggered. The VIX closed at an all-time high of 82.69 on March 16. Treasury yields touched record lows, and for a brief period, the short end of the curve (1M – 12M) went negative. In Q1, WTI crude registered its worst quarter on record (-66%). In the following month, the May contract collapsed to an extreme negative $40 per barrel, its first time in negative territory, caused by storage facilities nearing full capacity and investors having to pay to not take delivery. However, as crude plunged to record lows in April, equities were already in the early stages of a monumental V-shape recovery following massive amounts of monetary and fiscal stimulus by the Federal Reserve and Congress.
Over several steps throughout March, the Fed dipped into its “financial crisis” playbook by reinstating a zero interest rate policy and quantitative easing, establishing U.S. dollar swap lines to other major central banks around the globe, and introducing a Primary Dealer Credit Facility and a Commercial Paper Credit Funding Facility. The stock market later bottomed on March 23 after the Fed “doubled down” on its stimulus efforts. In an 8:00 a.m. press release, the Fed announced it was “committed to use its full range of tools to support the U.S. economy in this challenging time and thereby promote its maximum employment and price stability goals.” Reminiscent of Draghi’s “whatever it takes” declaration from the 2012-euro crisis, the Fed pledged to purchase Treasury securities and agency MBS “in the amounts needed” (aka unlimited QE). In addition, the Fed announced its entry into the private markets with purchases of agency commercial MBS, corporate bonds, and municipal bonds. Within the same week, Congress approved a large fiscal stimulus via the $2.3 trillion Cares Act, which provided direct stimulus checks to individuals, $659 billion for the Paycheck Protection Program (PPP), $150 billion for state and local governments, and additional weekly unemployment benefits through July 31, 2000.
In April, U.S. equity benchmarks rebounded more than 10%, marking the start of a historic V-shape recovery. It was the third-best monthly performance (+12.7%) for the S&P500 since WW II. Throughout the Spring and Summer, the initial rebound was characterized as the “working from home” trade. Early leaders were large-cap growth companies leveraged to technology and housing. The migration out of big cities combined with record low interest rates led to a surge in housing demand. Existing Home Sales reached a 15-year high by October. And with few places for people to travel and dine, the “home improvement” trade took flight.

In June, the Nasdaq 100 (NDX) was the first equity benchmark to return to new highs, followed by the S&P 500 (SPX) in August. A rotation into value stocks commenced in the fall on expectations for a vaccine and a reopening of the economy. The “recovery” trade took the lead in November following a trifecta of positive vaccine developments showing better than expected efficacy rates. In November, the Russell 1000 Value Index, the Russell 2000 Index, and the Russell Microcap Index all registered their best monthly performances on record. And the latter two indices, along with the Dow Jones Industrials (DJIA), returned to record highs. As the pandemic worsened into year-end with record cases, deaths, and hospitalizations all leading to increased lockdowns and a slowdown in economic activity, Congress passed a $900 billion fiscal stimulus package in late December. Accordingly, the large-cap NDX, SPX, and INDU benchmarks each closed the year at record highs.
Index Performance:

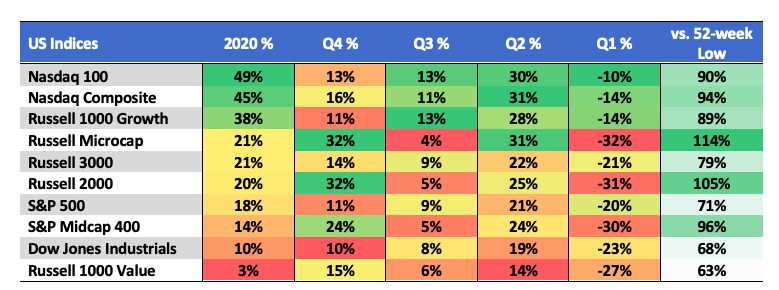
In terms of total return, the NDX (+49%) and Composite (+45%) were the top performers, while Growth (+38%) outperformed Value (3%) by a record 35 percentage points. The Dow (+10%) and Value were the laggards. Strong gains in Q4 allowed the Russell Microcap (+21%) and Russell 2000 (20%) to not only emerge from the red and finish the year with strong absolute gains, but both small-cap indices had the strongest rebounds off the March lows with each more than doubling.
Sector Performance:

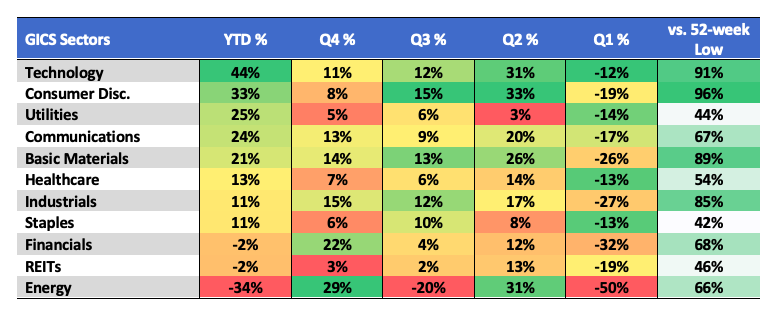
Technology (+44%) and Discretionary (+33%) led all sectors on a YTD basis as well as vs. the 52-week lows in March. Financials (-2%), REITs (-2%) and Energy (-34) were the only sectors to close out the year in the red.
Rates, Commodities, and the Dollar:
The UST 2YR Yield declined 145 bps to 12bps due not only to the Fed’s ZIRP policy, but also because of the central bank’s new approach to allow inflation to trend above the prior 2% target. The longer end of the curve bounced off the lows as economic activity recovered and on expectations that the future will be better. The 30YR Yield declined 75bps to 1.65%, while the 10YR UST Yield declined 101bps to 91bps.
The UST 10YR Yield spent the final two months of 2020 consolidating along the 96bps resistance level; a price point first reached back in June – now a six-month resistance line. A trend of higher lows has been underway since the August low. The long yield is now approaching the apex of the converging forces between resistance and support, indicating a breakout (up or down) is not far off. An upside breakout above 96bps projects a measured move to the 1.42%, which should bode well for Value/Cyclical sectors, particularly financials.

The Bloomberg Commodity Index (BCOM) was down as much as 27% at its March lows, touching levels not seen since in more than 40 years. Fortunately, a second-half recovery left it with a relatively modest decline of 3.5% to $78.05. Inflationary pressures were seen throughout individual members. WTI crude declined 21% to $48.52. However, on the upside, gold gained 25% to $1,898, and silver spiked 48% to $26.40. Both metals registered their best annual performance since 2010. Copper gained 26% while breaking out above the $327 resistance level, in place since 2014, to seven-year highs.
The US Dollar Index (DXY) declined 6.7% to 89.94.

Bitcoin made new all-time highs spiking 305% to $28,996 for its best year since 2017. Already in 2021, bitcoin has risen to a high of $34,793, +98% in less than four weeks from last month’s low of $17,589.

Looking Ahead:
The economy and the stock market are not one and the same, which may never have been more evident than the current times. The massive monetary and stimulus injections, along with expectations for improving economic activity in 2021, have driven the market to new highs. Some market historians argue the price action indicates we are in the early stages of a new bull market with meaningful upside to go. The economy, however, is still facing considerable headwinds from COVID-19’s third wave, and there are numerous risks that could slow the recovery further.
While vaccine distribution is already underway, there are concerns over implementation delays and supply shortfalls. There is also a growing concern COVID-19 mutates to more lethal or vaccine-resistant strains. With no signs of the third wave peaking and the potential for further increases in lockdown measures, a slower than anticipated economic recovery is possible while small businesses are already suffering immensely. Rising government debt burdens and the potential for a revised corporate tax code put upward pressure on tax rates. Deepening central bank interventions and liquidity-driven markets increase market distortions, and the impact of potentially higher interest rates increases the risks to asset prices. Inflation is surfacing in select areas of the economy, and the UST 10YR breakeven rate has quickly rebounded to 2% from below 50bps in March.
From a market perspective, bad news on the COVID-19 front could be a silver lining. Fiscal and monetary support could limit the market’s downside and provide a bridge to a more sustainable economic recovery in the back half of 2021, as policymakers are pressured and willing to provide additional stimulus. Over the near-term, the market may be ahead of itself and pricing in too smooth of a recovery. Extreme bullish sentiment measures (CBOE put/call ratio, fund manager surveys) suggest a near-term pullback could be overdue. However, longer-term momentum is to the upside, and a vaccine that unleashes the full strength of the U.S. economy could be the overriding narrative supporting a rising bull market throughout 2021.
The information contained herein is provided for informational and educational purposes only, and nothing contained herein should be construed as investment advice, either on behalf of a particular security or an overall investment strategy. All information contained herein is obtained by Nasdaq from sources believed by Nasdaq to be accurate and reliable. However, all information is provided “as is” without warranty of any kind. ADVICE FROM A SECURITIES PROFESSIONAL IS STRONGLY ADVISED.
The views and opinions expressed herein are the views and opinions of the author and do not necessarily reflect those of Nasdaq, Inc.

