 Credit: Shutterstock photo
This is the time of the month that Econintersect begins to prepare their economic forecast for August 2012. Sitting here working on the forecast and listening to CNBC in the background – the images in my head are one of an economic roller coaster with an abyss in the distance.
This past week has seen many economic ups and downs:
- soft existing and new home sales (bad)
- initial unemployment claims down significantly (good)
- Spain debt financing at Post-Euro high, all while further evidence Europe / UK in recession (bad)
- European Central Bank President Mario Draghi says he will save the Euro (good)
- soft existing home sales and pending home sales (bad)
- durable goods new orders strong (good)
- GDP at 1.5% (I don’t know if it is good or bad – the data is mixed and the BEA reset the baseline – read Doug Short’s and my analysis here).
The USA economy is running so close to zero that the question on everyone’s mind is not if, but when, the next recession will start. This creates a mindset (at least for me), to look extra hard for recessionary evidence. Every piece of bad data gets magnified, while good news is shrunk in proportion.
I have no special crystal ball to share about the timing of any upcoming recession. All I can say without fear of contradiction, the data we have seen for June (which is subject to revision) shows an expanding economy. Going with the big four economic elements the NBER considers other than GDP – the latest data was improving.
Month-over-Month Growth Personal Income less transfer payments (blue line), Employment (red line), Industrial Production (green line), Business Sales (orange line)
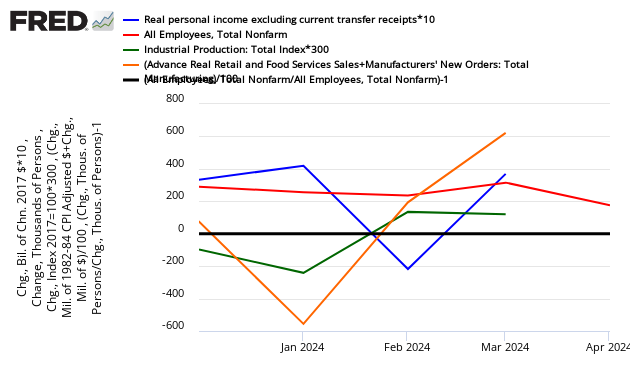
Personal income was in a 3 month improving trend, employment has been growing for two months, all while industrial production has been up and down but, overall, expanding for the last 3 months. The final data is not in on noisy business sales for June – but this too seems will likely be positive based on advance data.
I am a simple passenger on a roller coaster ride. I don’t know whether to enjoy the ride or start screaming in terror.
Other Economic News this Week:
The Econintersect economic forecast for July 2012 shows continues to show moderate growth. Overall, trend lines seem to be stable even with the fireworks in Europe, and emotionally cannot help thinking this is the calm before the storm. There are no recession flags showing in any of the indicators Econintersect follows which have been shown to be economically intuitive. There is no whiff of recession in the hard data – even though certain surveys are at recession levels.
ECRI stated in September 2011 a recession was coming, and now says a recession is already underway. The size and depth is unknown. A positive result is this pronouncement has caused much debate in economic cyberspace.
The ECRI WLI index value remains in negative territory – but this week is again “less bad”. The index is indicating the economy six month from today will be slightly worse than it is today. As shown on the graph below, this is not the first time since the end of the Great Recession that the WLI has been in negative territory, however the improvement from the troughs has been growing less good.
Current ECRI WLI Index

Initial unemployment claims decreased from 386,000 (reported last week) to 353,000 this week. Last week’s decline appears to have been an anomaly as some pundits suggested. Historically, claims exceeding 400,000 per week usually occur when employment gains are less than the workforce growth, resulting in an increasing unemployment rate. The real gauge – the 4 week moving average – declined from 375,500 (reported last week) to 367,250. Because of the noise (week-to-week movements from abnormal events AND the backward revisions to previous weeks releases), the 4-week average remains the reliable gauge.
Weekly Initial Unemployment Claims – 4 Week Average – Seasonally Adjusted – 2010 (blue line), 2011 (red line), 2012 (green line)

Data released this week which contained economically intuitive components (forward looking) were
- Rail movements (where the economic intuitive components continue to be indicating a moderately expanding economy – however this past weeks data was very marginal);
- Both GDP and CFNAI data are rear view looks at the economy.
All other data released this week does not have enough historical correlation to the economy to be considered intuitive.
Click here - for a Scorecard Chart with active hyperlinks

The views and opinions expressed herein are the views and opinions of the author and do not necessarily reflect those of Nasdaq, Inc.
The views and opinions expressed herein are the views and opinions of the author and do not necessarily reflect those of Nasdaq, Inc.


%20to%20Open%20Automotive%20Plant%20in%20Macedonia%20-%20Analyst%20Blog%20%7C%20Nasdaq&_biz_n=20&rnd=103612&cdn_o=a&_biz_z=1743443991079)

