
DailyFX.com -
Talking Points
-Zigzags appear in the construction of many of the Elliott Wave patterns
-Zigzags subdivide as an A-B-C (5-3-5) sequence
-Many times, wave C can be estimated using common rations and channeling
In Elliott Wave theory, a zig zag is a pattern consisting of 3 waves labeled A-B-C. Most of the time, the pattern will print in the direction against the main trend and is typically a counter trend formation. Z ig zags are typically found in the 2 nd wave of a 5 wave impulse and have a part in the formation of Elliott wave triangles . Many times, zig zags appear somewhere within a complex correction. There are even a few instances where a zig zag will print in the direction of the larger trend . As a result, the zig zag pattern is an integral price pattern which can be found in several locations within the eight wave Elliott Wave sequence.
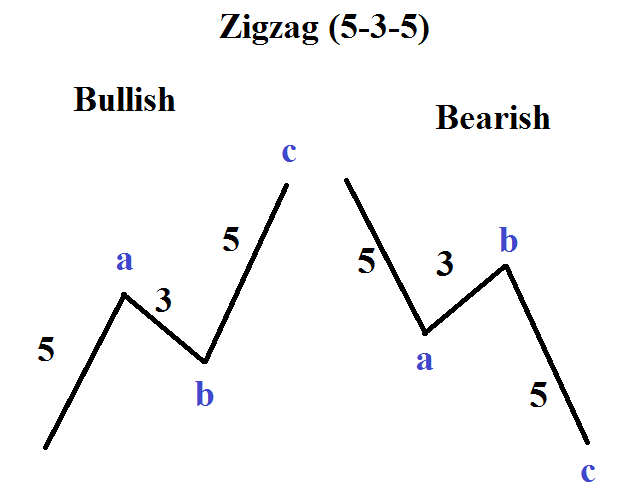
Zigz ags can print in either the bullish or bearish direction.
Idealized Bullish Zigzag
[Image 1]
Zig zags look like a lightning bolt on the chart. There are 2 rules for zig zags:
- The sub waves of an A-B-C zig zag appear as 5-3-5
- Wave B of the zig zag cannot retrace 100% of Wave A - most of the time wave B retraces 38-78% of wave A
[Image 2]
The 3 waves of the zig zag (A-B-C) subdivide as a 5-3-5 meaning the 'A' leg has 5 sub waves in it, the 'B' leg has 3 sub waves in it, and the 'C' leg has 5 sub waves in it. As a result of the 'A' and 'C' legs both containing 5 sub waves each, the impact of the whole zig zag structure is to be a deep retracement and recover a lot of price from the previous trend.
Also, the zig zag was designed to make progress against the tre nd. Therefore, wave B of a zig zag can be any 3 wave pattern (including another zig zag), but wave B cannot retrace 100% of wave A. A retracement of 99% is acceptable, though unlikely and progress needs to be made.
There are a couple of reasons why the 2 nd wave of a 5 wave impuls e is typically made up of a zig zag. The first reason is because the 1 st wave is the start of a new trend, the 2 nd wave can be latent desires for the old trend to continue. As a result, the 2 nd wave acts as a shake out for the new trend traders and the old trend traders as a deep retracement is typically obtained. Second waves typically retrace 50-78.6% of the first wave.
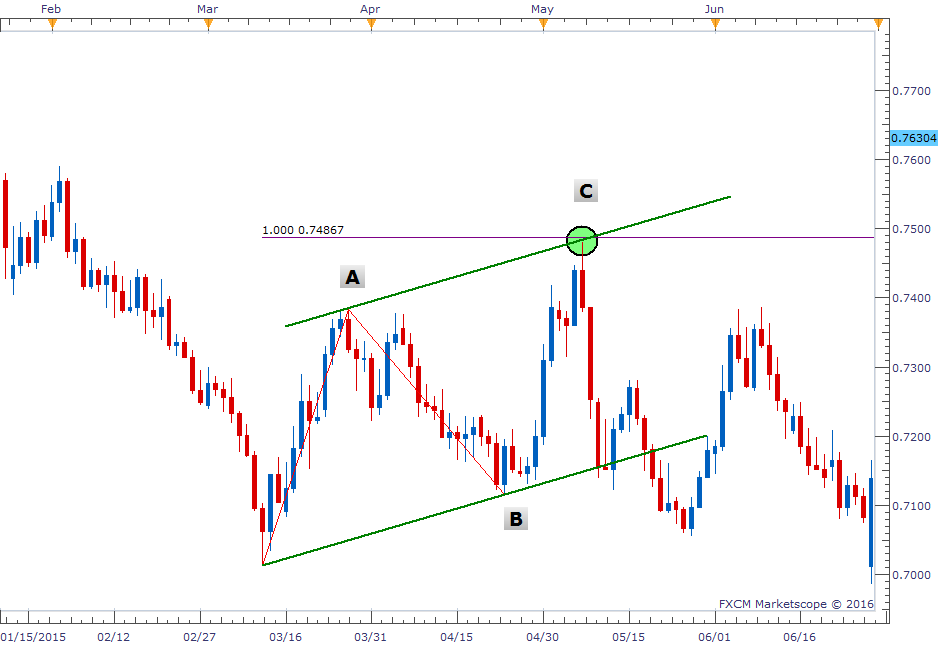
Within the zig zag pattern, many times you can estimate the termination zone of wave C. In Elliott Wave Theory, alternating waves tend to be related in distance . Therefore, once we believe wave C has started, we can estimate the length of C based on the length of A. Wave C typically has an equal measurement to wave A, or a .618 or 1.618 multiple of wave A .
In the example below, we can see where wave 'C' was equal in length to wave 'A' at the purple line labeled "1.000 0.74867."
[Image 3]
Additionally, it is common for the A-B-C zigzag to create a price channel. So we can use the price channel as a means to estimate the ter mination point of C and the zig zag pattern.
These price approximations become powerful when there are other wave relationships showing up in the same price zone as the estimated termination point.
---Written by Jeremy Wagner, DailyFX Education
Having a method to time trade entries is important. Managing your risk may be even more important. Learn how the better performing traders manage their risk by reading ou r Traits of Successful Traders research. [Free registration required.]
Follow me on twitter at @JWagnerFXTrader .
DailyFX provides forex news and technical analysis on the trends that influence the global currency markets.
Learn forex trading with a free practice account and trading charts from FXCM .
The views and opinions expressed herein are the views and opinions of the author and do not necessarily reflect those of Nasdaq, Inc.
The views and opinions expressed herein are the views and opinions of the author and do not necessarily reflect those of Nasdaq, Inc.
